The History of Low-Level Audio Background Noise Measurement
Especially
techniques of assigning
a single value to low-level background noise of various types,
according
to the degree to which humans find it annoying, disturbing or
interfering (in German: Störgeraüschen), with particular reference to
the relative merits of RMS detection (dBA) and quasi-peak detection
(CCIR 468 and related technical standards).
|
Robin Whittle rw@firstpr.com.au 2016-02-12
This history is reasonably
comprehensive, but not yet complete. I
worked on it in 2009 and made some updates in June and July 2013 and
June 2014. In February 2016 I adding an English translation of the 1933
Ulrich Steudel paper which pioneered this field. Please see the
update history: #updates.
While I have collated this information, and at times added my own
commentary, the most significant part of what lies below is that we now
have good English translations of some German papers from the 1930s to
the 1950s. The people who have worked on these translations have
not all been directly involved in this particular audio field.
Thanks very much to the translators whose work has been crucial to the development of this page!
If you have anything to add or this - any documents, corrections,
comments, suggestions etc. - please let me know.
The scope of this history
This history focuses on a particular
type of audio noise measurement. This page does not concern
high-level noise, such as the health-threatening environmental noise in
workplaces, or in residential areas due to nearby road traffic or
aircraft. This history is of the techniques and technical
standards for using electronic hardware - and now software - rather
than trials with human listeners, to measure the degree to which humans
are likely to be annoyed by low-level background noise while listening
to something else, such as music, speech or any other sound signal of
interest to them. This includes especially when the audio
programme material is of a low enough level that it does not mask the
noise signal in the human auditory processing system.
The German word Störgeräusch is used to refer to low-level background noise of various types,
according to the degree to which humans find it annoying, disturbing or interfering.
This field primarily concerns assigning a single number to the measured
noise signal in isolation, rather than multiple numbers or a spectrum
of what the human auditory tract would perceive. Such numbers should
enable an educated person to reliably evaluate, for instance, the
self-noise of different microphones and/or pre-amps, in a way which
matches the actual performance of these devices in typical recording
environments.
This field is not directly concerned with the masking properties of the
auditory tract (one high level signal making an otherwise audible lower
level signal at a different frequency less audible). this would
be required to model the perceived degree of background noise
interference in the presence of a given audio programme.
The most significant technical standards in this field are CCIR 468 and
its derivatives, involving quasi-peak detection of the filtered noise
signal. However, these techniques are only used by some equipment
manufacturers at present. Many or most manufacturers give dBA
figures for background noise. So this history concerns debate
between the relative merits of dBA measurements (filtering followed by
RMS detection), the CCIR 468 approach and other approaches.
These techniques are of particular interest regarding:
- The self-noise of microphones, such as due to thermally driven
air molecule bombardment of the diaphragm, plus internal electronic
pre-amp noise, electronic thermal (Johnson) noise and any other sources
of background noise.
- The continuous background noise of pre-amplifiers and
analogue-to-digital converters.
They may also be of interest for any
other source of noise which may be present in a system, in combination
with any or all of the above:
- Interference from external sources such as radio transmitters in
cell-phones.
- Power-supply noise in computers or perhaps ground-noise between
systems, such as between a personal computer and an external audio
amplifier or pre-amp. This noise may vary with CPU activity.
These sources of unwanted signal are
not caused by or related to the audio programme. (If they were,
then this would be a form of intermodulation "distortion", including
perhaps how the input signal alters the behaviour of a poorly designed
sigma-delta analogue to digital converter to produce "birdie" tones.)
The sum of these noise signals constitutes a potentially annoying
"background noise" which detracts from listening enjoyment and/or the
ability to accurately perceive the audio programme material. The
goal of the techniques and standards which this history concerns is to
use hardware or software to measure the sum of these noise signals and
to predict the annoyance or other disturbances this would cause to a
listener, without any assumptions being made about the programme
material.
Since human audio perception is strongly affected by level, when
measuring a noise signal in analogue electronic form or in a digital
datastream or file, it is necessary to relate this to a physical noise
level presented to the listener's ears. For instance, when
specifying the self-noise of a microphone, the self-noise figure
relates to the equivalent sound pressure level in air which would be
required to produce such a noise signal in a noise-free
microphone. When measuring the self-noise of a pre-amp and/or
ADC, such as in a digital audio recorder, the measured self noise can
be combined with a microphone sensitivity to yield an equivalent sound
pressure level for these sources of electronic noise. Ideally, we
would be able to combine this measurement figure with the self-noise
figure of the microphone and produce a third figure which accurately
predicts the degree of annoyance or disturbance of the mic and recorder
in combination, referenced again to the sound pressure of noise which
would have to occur in air to create the same level of disruption if it
was fed to a noise-free microphone, pre-amp and ADC. I am not
sure if the current state of the art supports reliable addition or
other methods of combining these noise figures.
Technical Standards Working Groups
- AES SC-02-01 Working Group on Digital Audio Measurements. (link)
- AES SC-04-04 Working Group on Microphone Characteristics. (link)
Participation in these Working Groups
is open to people who are not AES members. This page
http://www.aes.org/standards/development/membership.cfm
links to a form for requesting participation in AES Standards Working
Groups. Each WG has a mailing list with a membership list and
archives which are open to members of the WG. In March 2012,
measurement of low-level noise was being discussed on the SC-04-04
mailing list.
This field is also important to the IEC standard on microphones
60268-4, which as of the 4th edition (2010) adopts quasi-peak noise
detection as the mandatory method of measuring the inherent self-noise
of microphones:
Please let me know of any other organisations or
WGs which have an interest in this subject.
Copyright and attribution
While the material I have written below
is copyright 2009 to 2013 Robin
Whittle, please quote and use portions of it as you please, with
attribution to this page http://realfield.com/anm/history/ .
Please let me know if you cite or quote this material. This is a
stable URL and I intend to maintain and ultimately improve this page in
the future.
Below are one or more PDFs of original papers, some from 60 years
ago. I have not fussed over copyright for these important
papers. They report on work done by publicly funded organizations
and so should not be locked up in paid-for-access repositories.
In one case so far I have also provided an English translation of such
a paper, thinks to the kind efforts of someone else. I claim no
copyright over these documents.
If someone wants to work on the two
things I set out to do:
- Research and publish the history of audio low-level measurement.
- Create software which can examine a digital audio file of
background noise, such as that of a microphone, pre-amp, or perhaps an
analogue-to-digital converter and perform a Quasi-Peak noise
measurement on it, which is for all practical purposes compliant with
the CCIR 468 standard, or whatever takes its place now and in the
future.
then
I will do whatever I can to help.
<<< To the parent directory - including my
plans for software to perform these noise measurements on a test signal
in a .WAV file.
This is a work in progress and will remain as a permanent page.
This field has not been comprehensively reviewed since Herman A. O
Wilms' 1970 paper: Subjective or
Psosphometric Audio Noise Measurement: A Review of Standards.
#Wilms-1970 . Please see the 1970
section below for Wilms' explanation of the origin of the word psophometer, pronounced so'fameter.
Please
help me improve this page with:
- Any documents you can send or point me to.
- Analogue circuits or DSP software implementations of weighting
filters, quasi-peak detectors etc.
- Links to other sites of interest, books, papers etc.
- First-hand knowledge of the history of these standards and with
your experience measuring noise.
- Your critiques, support or whatever for various approaches.
Please either send me a link to where you have written about this, or
give me some text to add to the Viewpoints section of this page.
I would like this page to either contain, or link to, as wide a range
of viewpoints as possible.
Contents
>>>
Scope
>>> Overview of audio standards organizations
>>> Timeline
>>> Origins
of the CCIR 468 weighting curve and quasi-peak detector
>>> Major standards
>>>
Viewpoints
>>> Links
>>> References
>>> Update history
Scope
This page only concerns low-level noise
as
perceived by humans. It concerns noise with physical, acoustic,
origins and noise which is generated by electronic circuits. The
noise of
interest here is always of a low level - so this is background noise,
and perhaps distortion products, which are ideally below the program
signal, including when the program is silent. This discussion is
not concerned with measuring noise at higher levels, such as in
industrial settings, aircraft noise etc. This discussion is
primarily about random noise, potentially with spiky impulses etc. as
distinct from noise which has strong tonal elements.
My particular interest is measuring the self-noise of microphones, but
ideally, I think, the same system of weighting and metering noise
should be just as good for measuring noise from pre-amplifiers, power
amplifiers, ADCs, DACs, analogue recording systems, radio transmission
systems etc.
In particular, I am keen to identify one pair of filtering and metering
techniques which will give a single figure which correlates well with
subjective experience, without there first having to be any assumptions
about the nature of the noise itself - for instance, whether it is
"smooth", "impulsive" etc.
The most prominent existing methods of measuring these types of audio
noise are:
- A weighting with RMS detector.
- CCIR-468 (and the standards from other organisations which were
derived from it) weighting
with a particular kind of Quasi-Peak detector.
- The Dolby approach, "CCIR-AMS", which uses the same CCIR 486
weighting curve with a different reference level, and an average
detector. (This use of "CCIR" is not authorised or supported by
any standards body.)
- Other standards, papers, technical reports, weighting curves
and detectors of
historical interest.
My view is that the CCIR-468 weighting
filter and Quasi-Peak detector is the best of the widely recognised
techniques.
I am not trying to document the Peak
Programme Meter vs. VU meter debate, however this is a parallel and
closely related debate which has, no-doubt, influenced opinions on how
best to detect audio noise and generate a meter signal.
Overview of Audio Standards Organizations
A detailed description of audio
standards, particularly from the IEC, appears in
#Weeks-1999
(in the Audio Engineer's
Reference Book). Another overview is:
#Bohn-2000
Bewildering Wilderness - Navigating
the complicated and frustrating world of audio standards,
by Dennis A. Bohn.
AES
Audio Engineering Society
http://www.aes.org/standards/
. These working groups are open to anyone, whether an AES member
or
not, but only for the purposes of developing standards - not for
reporting activities.
I am an AES associate member and I paid
extra for free access to the AES Library, which has the AES papers
listed
below. I am also a member of two AES working groups: SC-04-04
(microphones) and SC-02-01 (digital audio measurement
techniques). Members of working groups have access to some
current and past standards.
ASA
American Standards Association, now the American National Standards
Association:
http://www.ansi.org
.
BSI
British Standards Institution
http://www.bsigroup.com
. I have not found any BS (British Standards) which play a primary role
in this field. There are British Standards which are identical
to, and therefore derivative from, IEC standards. For instance
"BS EN 60268-4: 2004" (microphones) is identical to "IEC 60268-4:2004",
which is the 3rd edition. Previously, the BS standards had
different numbers, so "BS 6840-4:1997" was identical to "IEC
60268-4:1997" (2nd edition).
CCIF
According to the ITU
history
, under the ITU (International Telegraph Union) CCIF (International
Telephone Consultative Committee) was formed in 1924. The next
year, the
CCIT (International
Telegraph Consultative Committee) was formed.
CCIR
The ITU formed the
International Radio Consultative Committee
(CCIR) in 1927. (Another ITU history.)
Note: the standards CCIR 468-1, 468-2 etc. are different versions
of the one standard, as it was updated over the years.
CCITT
In 1956 the CCIT and CCIF merged to form International Telephone &
Telegraph Consultative Committee (CCITT).
DIN
http://www.din.de
Deutsches Institut für Normung, the German Institute for
Standardization has influence far beyond Germany. For instance,
in electrical connectors and standards for paper size (A4 etc.).
IEC
International Electrotechnical Commission
http://www.iec.ch
was founded in 1906 and became part of ISO (International Standards
Organization) in the 1947, ISO's foundation year.
IEC standard numbers had 60,000 added to them in 1967, so
IEC 268-1 became IEC 6028-1. The "-1" does not represent a
version number, as it does with CCIR. It denotes a particular
standard within a larger set of standards. See list at:
en.wikipedia.org
.
So IEC 60268-1 is the first of a set of 18 standards concerning
audio. IEC 60268-4 is a separate standard, which happens to refer
to some parts of IEC 60268-1. Each such IEC standard has one or
more versions denoted by an edition number. For instance, IEC
60268-4 on microphones, is (2009) about to be updated to its 4th
edition.
ITU-R
http://www.itu.int/ITU-R/
In 1989, the ITU was re-organized, ending the previous divisions
of CCIR and CCITT. (However
#Weeks-1999
states that this change occurred in 1994.) These were replaced by ITU-T
for
Telecommunication
Standardization, the ITU-R for Radiocommunication Standardization and
the ITU-D for Telecommunication Development. ITU-R standards may
include "BS", such as "ITU/R BS.468-4". I understand this stands
for Broadcasting service for Sound.
Here is a 2002 version of Recommendation ITU-R BS.468-4 Measurement of audio-frequency noise voltage in sound broadcasting,
of which there were previous versions in 1970, 1974, 1978, 1982 and
1986. This describes a weighting curve and an inductor-capacitor
circuit which realizes it. ITU-R-REC-BS.468-4.pdf
Timeline
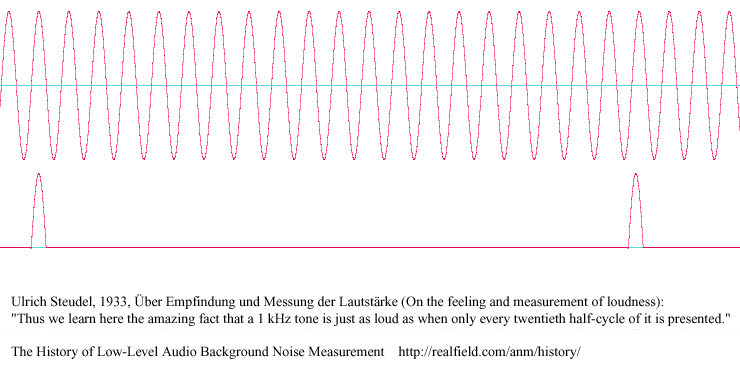
1933
Ulrich Steudel #Steudel-1933
performed work on the perceived loudness of impulse sounds, repetitive
impulses and pure tones with various attack and decay
characteristics. This is cited as foundational work for this
field in
#Belger-1953. Please see
#Steudel-1933
for a graphic scan of this article, which I received in June 2014 and
for the English translation, which I received in February 2016.
In June 2014 I was informed that an English translation of one sentence
(around the bottom of page 123
is:
Thus we learn here the amazing fact that a
1 kHz tone is just as loud as when only every twentieth half-cycle of it
is presented.
In February 2016 with the full English translation of this paper, we
can see that this statement refers to Fig 18. and spans the end of page
123 and the start of page 124. In the new translation, it is:
Here we learn the astonishing fact that a
1000 Hz tone is about as loud as if only every twentieth half-segment of it
is present.
Here are the two signals:
1934
The CCIF devised a noise weighting
curve which was replaced in 1949. The 1968 BBC report [
#BBC-1968-EL-17 page 8] described it as:
The earlier (1934)
version of the C.C.I.F. characteristic referred to in Section 1 was not
included in the present tests; it was abandoned in 1949 because it gave
insufficient weight to the lower- and upper-middle frequency range, and
it is not now used or proposed as a national or international standard.
See the 1952 section below for a depiction of this curve.
1947
Impulsive Interference in A.M. and F.M. , BBC Research Department Report G.036, Serial 1947/12.
#BBC-1947-12.
1948
There is a BBC Research Department report G.040 serial number 1948/24
Experimental Correlation Between Aural and Objective Parameters of Electrical Noise. This contains details of the weighting curve, meters and a photo of the experimental apparatus and listening room.
#BBC-1948-24 .
1949
According to
#Wilms-1970
(p 653), in 1949, the
CCIF
specified a weighting curve which was
adopted in 1954 by DIN in DIN 45 405. See the 1952 section below for a depiction of this curve.
This is the "P" curve as
discussed below in the 1970 section and, according to
#Wilms-1970 page 653 references 18
and 19 and page 656, reference 19, to the 1952 Mangold paper
#Mangold-1952
,
this curve was first suggested by AT&T. The full quote
from Wilms-1970 is in the 1970 section below. If this is correct,
then the AT&T suggestion must have been before 1949.
#Wilms-1970 page 652 states that
this "P" curve was used by "CCIF 1949 and CCITT 1954", and the
reference for both of these is the 1960 CCITT P33
Psophometer for Broadband Circuits.
#CCITT-1960.
Wilms also describes the response times of the "power proportional"
(quadratic with sound pressure, that is voltage squared) metering
circuit specified by this standard.
The BBC report [
#BBC-1968-EL-17 page 7]
cites what is
apparently the same 1949 CCIF standard as
#CCIF-1949
. According to
#Dolby-1978 the curve
used by DIN 45405 in 1972 (the 1967 version) was "developed in the
1940s".
This "P" curve was used by DIN 45 405 until November 1983 (see 1997,
Stephan Peus' paper) when it was replaced by the curve ("Q" in
#Wilms-1970). The "Q" curve
is used by CCIR
468-x, now ITU-R 468-4 and by other standards which refer to these
standards or reproduce their requirements.
#Belger-1953 also discusses the origins of this CCIF 1949 weighting curve.
According to #Smith-1970a
there is a standard:
The EIA Standards for Amplifiers for
Sound Equipment [EIA
(formerly RETMA) Standard SE-IO1-A,
"Amplifiers for Sound Equipment"
(July, 1949), pp. 2, 3.] utilize a weighted (ASA B curve) noise
level and specify the output noise in dBm.
1951
I have found various references to a
psophometric weighting curve specified in "CCIF-1951". I am not
sure it dates from 1951 and I am not sure exactly what it covers.
There are various "glossary" descriptions such as
http://www.atis.org/glossary/definition.aspx?id=2413
referring to "CCIF-1951" involving a reference of 800Hz rather than
1kHz.
For instance, page 1365 of the $1180 Computer Science and Communication
Dictionary Vol 2: (Kluwer / Springer 2000,
here
on Google Books) has such text.
1952
H. Mangold published a paper which I
have not seen a copy of, but would like to:
#Mangold-1952.
Grundlagen der Geräuschspannungsmessung
[
Fundamentals of psophometric audio
noise measurements], Rohde und Schwartz Mitt., no. 1, pp. 21-36
(1952). This is cited by three papers mentioned here:
#Belger-1953,
Wilms-1970
and
#Hertz-1977
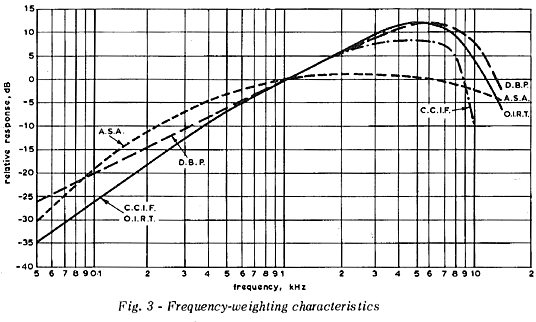
. The latter does not make specific mention of the paper, but includes
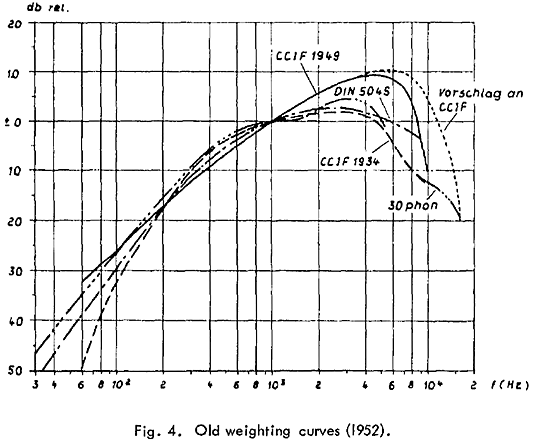
a graph of some weighing curves, from 1952. Since the Mangold
paper is the only reference dated 1952, I assume that the graph is from
Mangold-1952:
[2009-09-29 - maybe it is from Mangold
1952. A somewhat less clear version of the exact same graphic
appears in Ernst Belger's 1953 paper
#Belger-1953.]
"Vorschlag an CCIF" translates roughly as
"suggestion on CCIF".
The solid line "CCIF 1949" curve seems to match the CCIF curve in the
graph reproduced below from the 1968 BBC report. The above graph
does not show a curve equivalent to the "D.P.B" curve in the 1968
report, which was based on work by Ernst Belger published in
1953 #Belger-1953. The D.P.B. curve
evidently became the one chosen for CCIR
468.
On this basis, we might conclude that the "D.P.B" curve, which seems to
be the same as the Q curve in
Wilms-1970, was not known to H. Mangold in 1952 but was published the
next year.
1953
Ernst Belger, of
Institute fur Rundfunktechnik (Hamburg, Germany) published a paper
#Belger-1953 E.
Belger,
Über die Messung und
Bewertung yon Stögeräuschen [
On
the Measurement and Evaluation of Disturbing Noise].
In June 2013 I was delighted to receive an
English translation of this important paper - follow the above link to the references section.
Belger establishes the importance of peak detection, with carefully
chosen rise and fall times for the capacitor which is charged by the
peak detector, together with the choice of a suitable weighting curve
(audio filter). It seems that these techniques later became known
as "quasi-peak detection".
This paper describes the history of the field, the experiments he and
his colleagues conducted, and how they devised a weighting curve which
was most suitable for the task of measuring the disturbing quality of
background noise. Later documents indicate that this weighting
curve was adopted in CCIR 468 and so is used to this day (2013) in the
standards which are based on CCIR 468.
According to
#Wilms-1970, this
paper, or at least work around this time by Ernst Belger (see mention below of his 1954 paper), appears to
have had a lasting influence on the field regarding both weighting
curves and quasi-peak detection.
In June 2013 a correspondent in Germany kindly provided the
following note on the term "Störgeraüschen", or more
correctly "Störgeraüsche":
Störgeraüsche
is the plural of the singular Störgeräusch, which is comprised of .
"Stör" (interfere) and "Geräusch" (noise). Derivative terms
include:
Geräuschabstand: S/N (signal/noise) ratio.
Geräuschspannungsabstand (Spannung = voltage) weighted S/N ratio. Fremspannungsabstand (Fremd = foreign) unweighted S/N ratio.
The marvelous German way of building ever-more-specific terms by combining others also results in
Geräuschspannungsmessung (
#Mangold-1952) which
Google Translate recognizes as "noise measurement".
According to #Smith-1970a
there is a standard:
The IRE Standards
on Sound Recording and
Reproducing [IRE Standard 53 IRE 19 SI
(now IEEE Standard 191).
"Standards on Sound Recording and
Reproducing: Methods of Measurements
of Noise," 1953, p. 509-512.] which specify measurements
for various bandwidths, including flat, and an unweighted noise
measurement utilizing a 250 Hz high-pass filter with an 18 dB per
octave roll-off below 250 Hz, with an output noise referred to 1mW
(dBm).
1954
According to
#Wilms-1970
there is a standard:
CCITT 1954 ["Psophometer
for Broadband Circuits," CCITT
Recommendation P53, New Delhi
(1960), Red Book, vol. V, pp. 123-133.].
which he links with "CCIF 1949". According to
#Wilms-1970 this was replaced in
1970 by CCIR 468.
(I suspect there is confusion between CCITT, CCIR and CCIF in accounts
of these earlier standards.)
According to:
http://en.wikipedia.org/wiki/Noise_measurement
, CCITT P53 is now continued as CCITT 0.41. On page 3-109 of the
Audio Engineer's Reference (2nd ed. 1999) is the following description:
CCITT 0.41, Specification
for a Psophometer for Use on Telephone Type Circuits, Fascile IV.4,
(applicable to telephone noise only).
According to
#Hertz-1977 (page 9):
In the 1950's came
the German DIN standards 45405 and the CCIR Rec.(1954) which were
almost alike.
Both standards prescribe 2 measurements:
a) Flat characteristic with equivalent noise bandwidth
F = 33 kHz and RMS rectifier, called "Flat RMS".
b) Psophometric weighting curves and Quasi Peak
rectifier, called "weighted peak"
Both measuring results are to be stated, and the difference between
them will express the content of hum and higher harmonics in the noise
spectrum. At white noise, the difference will be appr. 5.9 dB.
In an earlier section, page 8, Hertz describes the Quasi Peak rectifier
as being:
characterized by
its charging and discharging time constants of approx 1.6 ms and 390 ms
respectively.
It has apparently not been possible to give a mathematical expression
for the transfer function of the Quasi Peak rectifier together with the
weighting curve.
Therefore, the standards for noise measuring instruments state a table
which specifies the instrument reading as a function of 5 kHz toneburst
of different width and repetition frequency.
(See 1974 for further quotes from Hertz-1977.)
Ernst Belger's second major paper in the field appeared in 1954:
#Belger-1954:
Ernst Belger, Über die Messung und
Bewertung von Störwirkung von Geräuschen, [Tr:
On the measurement and weighting of
interference effect of noise] Fernmeldetechnische Zeitschrift, 1954, 7, 1, pp. 25 -
32.
1959
According to #Smith-1970a
there is a standard:
The EIA Standards
for Audio Broadcast Facilities
[EIA Standard RS-219, "Audio Facilities for Radio Broadcasting Systems"
(April, 1959).] require a S/N measurement with a
flat response +/- 2 dB, 50 Hz to 15 kHz, referenced to a "standard
output".
1961
According to
#Langmuir-1962
the IEC published
ASA S1.4-1961,
which was a revision of
ASA Z24.3-1944.
#Wilms-1970 gives the title for
ASA S1.4-1961 as "Specification for General Purpose Sound Level
Meters".
#Wilms-1970 also states that IEC
268-1 (1968) uses ASA S1.4-1961 and IEC 179 (1965) as a specifications
for its sound level meter.
#Langmuir-1962 has a graph and includes:
The new revision
now has electrical noise, microphone noise and extraneous influences
specifications.
The C weighting network frequency response in the ASA revision is no
longer flat but now has specific upper and lower -3 db points.
The weighting network tolerances are now much tighter.
The frequency response of the A
weighting network is based on the
approximate response of the ear at 40 db. The A network is
frequently used for measurements on speech interference and the
annoyance level of low level sounds, such as fans and audiometric booth
placement.
The B weighting network is based on the approximate response of the ear
at 70 db. The B network is frequently used for traffic interference
measurements, and higher level speech interference readings.
The C network is approximately the response of the ear at 85 db and
above. The C network is used for most measurements, spectrum analysis,
peak level indicators, and high intensity sound.
1962
The paper
#Langmuir-1962
describes (p
322) a "quasi-RMS" metering circuit with
shaped magnetic poles, but this is not really RMS.
A bridge rectifier
charges a capacitor via a resistor r and the capacitor is discharged
via a total resistance (r1 + r2), where r2 is the resistance of the
meter. A second capacitor can be placed in parallel with the
meter for
slower response.
#Peus-1997 mentions, without reference to any
earlier version, that
3.2.1. DIN 45 405
In 1962, the German standard DIN 45 405, "Geräusch- und
Fremdspannungsmesser für elektroakustische Breitbandübertragung"
("Noise level measurement in sound systems") was published. This
standard (last edition: 1967) defined, among other things, the
weighting curve shown in Figure5 (a) and a "quasi peak meter".
Therefore, many data sheets from European manufacturers include the
remark 'DIN 45 405, quasipeak' for the self-noise level.
Please see the 1997 section for the rest of this quote, with a diagram,
explaining how DIN 45405 was changed in 1983 so the weighting curve was
in line with CCIR 468. The paper warns that this gives rise to
two different technical specifications for DIN 45405 and that it is
important to state which standard was used in a given measurement.
1965
#Wilms-1970
(page 652) mentions
IEC 179,
1st ed. "Precision Sound Level Meters" (1965) as one of the
options for the meter (the other is ASA S1.4-1961) for IEC 268-1
(1968). This page also implies that IEC 179 and the ASA standard
both use "A" weighting.
#Hertz-1973 cites IEC 179 as:
"IEC Publication nr. 179 1965. Precision Sound Level Meters.
This was evidently extended with IEC 179A in 1973 to work better with
impulsive sounds.
1967
#Wilms-1970
mentions a standard from the German Deutsches Institut für
Normung, (now
http://www.din.de)
DIN 45 405 (now referred
to as DIN 45405):
"Geräusch- und
Fremdspannungsmesser für elektro-akustische Breitbandübertragung" [Psophometer for broadband circuits],
DIN 45 405 (1967).
Is this the first standard to specify noise detection with a
quasi-peak detector?
This 1967-07-01 version was replaced in 1983-11-01. In 2009-09,
the 1983-11-01 version of DIN 45405 is
still current and available for purchase. It is in German and its
title in
English is: "
Noise level measurement
in sound systems".
See
#Wilms-1970 for a more
detailed description of this standard in 1970 and how it may have
contributed to the adoption of quasi-peak metering in CCIR 468-2 in
1974.
1968
DIN 45
633-2 is released (AKA DIN 45 633 part 2). This is not to
be confused with separate standards 45 655-1, 45 633-3 etc.
There is very little trace of this standard in 2009, but it seems to
have played an important role in this field. The full details of
the standard, taken from Wilms-1970 reference 9 are:
Präzisionsschallpegelmesser;
Sonderanforderungen für die Anwendung auf kurzdauernde und impulsartige
Vorgäinge (Impulsschallpegelmesser)" [Additional requirements for the
extension of the precision sound level meter to an impulse sound level
meter], DIN 45 633, Part 2 (1968).
I suspect that IEC 179 or IEC 179A (some web pages indicate the latter
is from 1973) is related to this DIN standard. They are all concerned
with accurately measuring impulses of noise. I think this is
mainly safety and high levels of noise, where A weighting is more
appropriate than it is for low levels of background noise.
Some information on the response times of the metering systems
described by DIN 45 633-1 and DIN 45 633-2 can be gleaned from:
http://www.rz.fh-muenchen.de/home/fb/fb05/akrt/Messtechnik/hp/kap5.pdf
Die Integrationszeiten
für die Effektivwertbildung betragen für die verschiedenen
Anzeigearten:
Slow Anzeigeart Langsam nach DIN 45 633
(1) bzw. Slow nach IEC 179
Integrationszeit ≈ 1 s
Fast Anzeigeart Schnell nach DIN 45 633 (1) bzw. Fast nach IEC 179
Integrationszeit ≈ 125 ms
Impuls Anzeigeart Impuls nach DIN 45 633 (2)
Integrationszeit ≈ 35 ms.
A translation is:
The integration times for the different modes of RMS reading amount to:
Slow mode Langsam (slowly) after DIN 45 633-1
and/or Slow after IEC 179
integration times 1000 ms.
Fast mode Schnell (quickly)
after DIN 45 633-1 and/or Fast
after IEC 179 integration time 125 ms.
Impulses mode Impulse
after DIN 45 633-2 integration times 35
ms.
#Wilms-1970
mentions
IEC 268-1 1st ed,
(1968) "Sound System Equipment" and
describes it as having unweighted or A-weighted filtering and RMS
detection (quadratic with sound pressure) with time-constants according
to one of the two previously defined meter standards.
See the
#Wilms-1970 for a more
detailed description of this standard in 1970.
This 1st edition was replaced with a 2nd edition in 1985. I don't
have a copy of the 1st edition. The 2nd edition, 1985, with two
amendments in 1988, is available to members of AES SC-04-04. I
understand this is still (2009-09) current, although it is now known as
IEC 60268-1. IEC (60)268-1 is the first of a series of
standards. One of them - (60)268-4, concerns microphones and
separately from (60)258-1 specifies weighting filters and a metering
system. IEC (60)268-4 is about to be revised to a 4th edition in
late 2009 or in 2010.
#Wilms-1970
also mentions
DIN 45 633 Part 2:
"Präzisionsschallpegelmesser;
Sonderanfordertmgen für die Anwendung auf kurzdauernde und impulsartige
Vorgänge (Impulsschallpegelmesser)" [Additional
requirements for the extension of the precision sound level meter to an
impulse sound level meter], DIN 45 633, Part 2 (1968).
See 1970 below for a quote from
#Wilms-1970
which indicates that this standard too may have contributed to
the adoption of quasi-peak detection in CCIR 468-2??? in 1974.
BBC report: The Assessment of Noise in Audio-Frequency Circuits
This report [
#BBC-1968-EL-17] is freely
available. I think it is essential reading. I understand it
played in
important role in the creation of CCIR 468-1 (1970) Here
are some
excerpts:
(page 2)
To decide the best form of objective measurement and to establish
working tolerances in terms of the techniques adopted, subjective
measurements of noise are necessary. Unfortunately, no tests of
this type have been carried out since the early 1950's and such results
as are available are in some respects inconclusive or contradictory.
Thus, Maurice, Newell and Spencer [
#Maurice-1950]
compared the performance of an RMS meter used in conjunction with the
CCIF 1934 weighting characteristic with that of the BBC Peak Program
Meter in conjunction with the CCIF 1949 characteristic; the former
combination was found to give better agreement with the subjective
assessment of the various types of noise investigated.
Belger [
#Belger-1953,
#Belger-1954],
also working on the basis of subjective tests, found a particular type
of peak-reading meter preferable to an RMS-reading device
(thermocouple) and the 1949 weighting characteristic preferable to the
1934 version, but produced at the same time evidence in support of a
further change in the weighting law.
See below ????????????? where
#Belger-1953
is cited as the original source of a curve
which was later chosen as the CCIR 468 curve, the preferred weighting
curve to this day (2009).
The report mentions there were four different types of meter and four
different weighting networks either in use or proposed. The BBC
tests are described as taking place under conditions appropriate to VHF
FM transmission. They restricted their research to existing meter and
weighting systems, rather then developing new ones.
Their tests used a high quality monitoring loudspeaker LS5/5, which is
described at
http://www.mhennessy3.f9.co.uk/rogers/bbc_txt.htm
as a 3 way system with 12" woofer, 8" cone midrange and Celestion HF
1400 tweeter. The speaker's effective bandwidth was 14 kHz and
observers sat on the axis of the loudspeaker at a distance of 2.5
metres. This involves less high frequency coupling to the ear
than a side-on
alignment, or the use of headphones.
Subjects assessed noise in terms
of the annoyance it caused and whether it "obtruded upon the observer's
consciousness". The results for these two criteria were closely
matched. The tests involved classical music and dramatic readings
-
not pop or jazz music or "didactic" speech such as news bulletins.
Ambient noise in the listening room was measured at 30 dB A
weighted. This corresponds to the quieter of the two listening
rooms used by Belger [
#Belger-1954].
The BBC tested four weighting curves. One of them, the "D.B.P" (
Deutsche
Bundespost) is the "telecommunications authority in the Federal German
Republic (West Germany). This is the same curve later chosen for
CCIR 468-1, and the quotation below gives some information about its
earlier origins.
The curves are described, with the first two descriptions paraphrasing:
CCIF
Adopted by CCIF (now [1968] the CCITT) in 1949
#CCIF-1949.
This is the same curve as was used in DIN 45 405 from 1954 to
November 1983, and is known as the "P" curve in H. A. O. Wilms' 1970
paper.
ASA
This is the American Standards Association
A curve, which is also used by IEC
publications 123 and 179.
D.P.B.
This characteristic is based on subjective tests described by Belger [
#Belger-1953].
It is given, in a contribution by D.P.B (the Telephone Administration
of the Federal German Republic) in the "Red Book" (Vol. 1, 1957)
covering the first plenary assembly of the CCITT (Geneva 1956).
According to the above Ernst Belger
devised this weighting curve in 1953, which is now the CCIR / ITU-R
468-X weighting curve of the present day (2009).
O.I.R.T
This characteristic was proposed by the OIRT at the 1966 meeting of the
CCIR. It is stated by the OIRT to be based on "numerous studies" of
which, however, no details were given.
A variety of meters were tested. Two I will only mention: BBC
Peak Programme Meter and the VU meter. Those of interest are:
I.R.T Meter
A commercial valve implementation of the quasi-peak meter specified by
DIN 45 405. Responds quickly to brief signals.
CCITT Psophometer
Specified by the 1949 CCIF (now [1968] the CCITT) specification [
#CCIF-1949]. They used a transistor
version.
It employs a
nominally square-law rectifying characteristic, and its dynamic
response is entirely determined by the mechanical constants of the
meter movement.
Modified OITR meter
Please see the BBC text for full details, including Appendix I..
The OIRT between 1963 and 1966 suggested the use of a meter of the type
suggested by
#Niese-1957. No such
meter was available, and a modified version of an OITR-specified meter
was used instead.
As a result of their tests, the BBC decided that the Modified OIRT
meter was preferred.
They chose the DBP curve as being the best of those tested, with the
OIRT curve being the next best choice.
1970
CCIR 486-1
The first edition of the
CCIR 468
standard was first published. This is cited in
#Wilms-1970 as:
"Measurement of
Audio-Frequency Noise in Broadcasting in Sound-Recording Systems," CCIR
Recommendation 468, New Delhi (1970).
???????????
While this standard was modified in some respects in later versions
(468-1, 468-2, 468-3 and 468-4), its weighting curve
("Q" in the diagram below from Wilms-1970) has remained the same to the
present day. Quasi-peak detection was added in the 2nd edition
CCIR 268-2 in 1974. With CCIR's demise, the standard was passed
on to CCITT and then to the ITU-R. See quotes from Wilms-1970
below for more details.
Smith and Wittman, Shure Brothers Inc.
A. Douglas Smith and Paul H Wittman of Shure Brothers Inc USA publish
Design
Considerations of Low-Noise Audio Input Circuitry for a Professional
Microphone Mixer
#Smith-1970a
- a paper first presented in April 1969. They mention three
standards regarding noise measurement (see years above for more
details):
This detailed 16 page paper presents a great deal of theoretical and
practical information and states that noise must be measured with a
true RMS meter ( p 144):
When either the dBm
or dBv method is used to measure and rate EIN (Equivalent Input Noise),
it must be realized that the voltage of Eq. 1 is expressed in RMS
volts. Noise voltages should thus be measured with a true RMS reading
voltmeter.
Herman A. O. Wilms' major paper
Herman A. O. Wilms published a paper
Subjective
or Psophometric Audio Noise Measurement: A Review of Standards #Wilms-1970 .
I think this is essential reading for anyone concerned with the history
of this field.
Wilms comments on
#Smith-1970a, chiding its
American authors for not mentioning European standards.
(They reply in
#Smith-1970b .)
The origins of the term
psophometer
are given on page 651:
One must instead
use a special "subjective audio noise meter," usually known (especially
in Europe) by the Greek word for noise meter, psophometer (so'fameter).
(The Ancient Greeks never fail to impress . . .)
He identifies three factors in the measurement
process: the choice of a weighting filter, the choice of a detector and
the choice of integration time. The two types of detector are
(page 651) :
... sound pressure
proportional (linear with voltage) or sound power proportional
(quadratic with voltage, often called RMS).
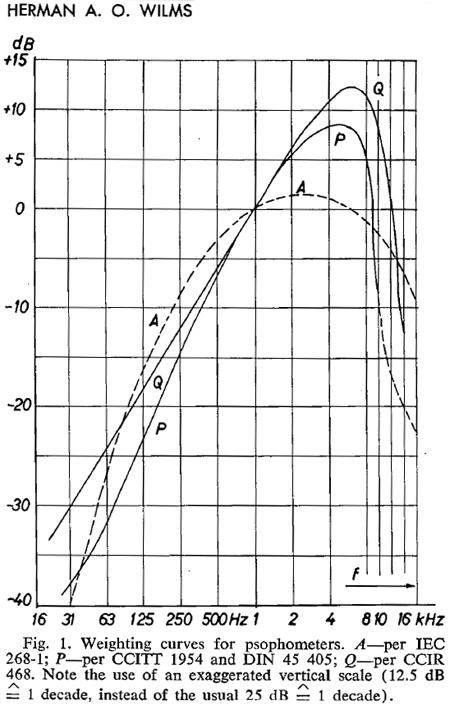
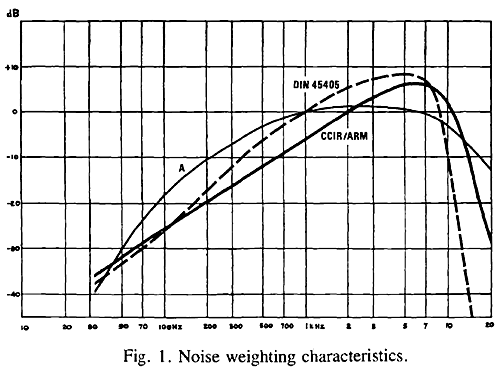
Figure 1 shows the A weighting curve, the "P" curve of the 1954 CCITT
DIN 45 405
(originally suggested to CCIF in 1952 by AT&T, as noted below), and
the "Q" curve, as used to the present, which was used in
CCIR 468, but which may have originated
in
#Belger-1953 ????.
Fig 1 from
#Wilms-1970.
Other items from
#Wilms-1970 are:
A list of international standards (see years above and notes below for
more details) (pages 652 and 653):
-
1949 and 1954: CCIF 1949 and CCITT Recommendation P53 1954,
though the reference is to a 1960 version of P53.
-
1961: ANSI S1.4-1961.
-
1965: IEC 179.
-
1967: DIN 45 405 (AKA DIN 45405.)
-
1968: IEC 268-1.
-
1970: CCIR 468, the first version AKA CCIR 468-1.
Here is Wilms' initial description of these standards.
IEC 268-1 (1968)
(Page 652.)
For unweighted
(wide-band) noise measurement the response is flat between 22 Hz and 22
kHz, and the roll-off shape is the same as for octave filters.
For
weighted measurements, the A-weighting
network shown in Fig. 1, and
used in the sound level meter (IEC 179
[1965] or ANSI S1.4-1961), is
specified.
The amplitude response is power proportional (quadratic
with sound pressure ), and the time constant is the same as in the
sound level meter in the "fast" position, namely, about 100 ms (i.e., a
90% response for a 200-ms tone burst).
So the 1st edition of IEC 268-1, used A weighting with RMS
metering. We will see below that version 2 (1985) used the "Q"
curve with quasi-peak metering (identical to CCIR 468-3).
IEC 268-1 (after 1997 IEC 60268-1) is a general standard, the first of
a series. It is not to be confused with IEC 268-4 (1st edition,
1972, now known as IEC 60268-4) in its 3 editions (a 4th edition in
late 2009 or in 2010) which concerns microphones.
CCIF 1949 and CCITT 1954
I am not entirely clear what the CCIF 1949 standard was, but the "CCITT
1954" standard is cited as:
"Psophometer for Broadband Circuits," CCITT Recommendation P53, New Delhi (1960), Red Book,
vol. V, pp. 123-133.
(Page 652.)
For unweighted
measurements, the response is flat between 31.5 Hz and 20 kHz.
For weighted measurements a filter having a response versus frequency
characteristic of the curve P in Fig. 1 is specified. The amplitude
response is power proportional (quadratic with sound pressure [AKA
RMS], accurate for crest factors up to 2.5 times full-scale
deflection.
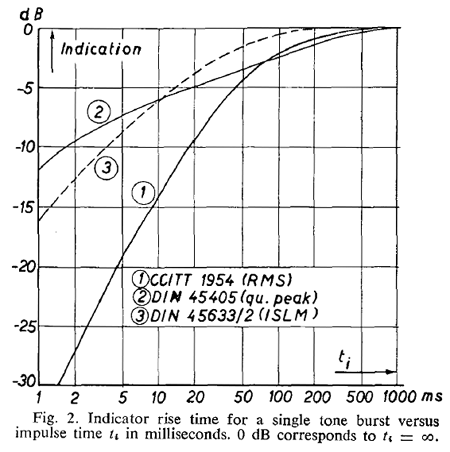
The dynamic response is described by requiring that a tone burst with a
duration of between 150 and 250 ms must give the same indication as a
continuous sinusoidal tone of the same amplitude, as shown in curve 1
of Fig. 2. [Below.] A decay time is not indicated, but is usually taken
to be
the same as the rise time.
See 1951 for some notes on a "CCITT 1951" standard.
DIN 45 405 (1967)
(Page 652.)
For the weighted and
unweighted measurements of noise levels this German standard uses the
same filters as the CCITT. [The "P" curve above.]
The dynamic characteristics are different, however; DIN 45 405
specifies
an amplitude response which is linear with sound pressure, and a
faster, multiple time-constant rise time: a single tone burst of 10 ms
must give an indication of 48% (-6.37 dB) of the value with a
continuous tone, and a 200-ms tone burst must indicate 80%, as shown,
in curve 2 of Fig. 2. (This reading with a faster rise time is
called quasi-peak.)
A long decay corresponding to a decay time constant of about 350
ms. The specification is that a tone burst of 5 ms on-time every
100 ms shall give a reading 1.5 dB below the indication for a
continuous sine wave of the same peak amplitude.
CCIR 468 (1970)
The first edition was known as CCIR 468. As far as I can
tell, CCIR 468-1 was in 1974 and it was revised, but still known as
CCIR 468-1 in 1976. The original version from 1970 has the "Q"
curve, but does not use quasi-peak
metering.
(Page 652)
This new international
standard recommends that for the measurement of audio-frequency noise
in broadcasting and sound recording systems the weighting network have
a response characteristic in accordance with curve
Q in Fig. 1.
The amplitude response and dynamic characteristics are not yet
specified; CCIR Report 398-1
#CCIR-1970-398-1 of Study Program 2A/10
["Measurement of
Audio-Frequency Noise in Broadcasting and in Sound Recording Systems,"
CCIR Report 398-1, Study Program 2A/10, New Delhi (1970).] notes,
however, a trend towards using a faster measurement like DIN 45 405
(psophometer) of DIN 45 633/1 (impulse SLM 1968) instead of the
previously used "fast" rise time of about 200 ms.
Later editions of the same standard are known as CCIR 468-2, CCIR 468-3
and ITU-R 468-4. All these later versions use quasi-peak metering
and retain the "Q" curve of the first edition.
I think this reference to: "DIN 45 633/1 (impulse SLM 1968)" may mean
DIN 45 655-2, which was released in 1968, rather than to DIN 45 633-1
itself. So it seems that the two standards DIN 45 405 (1967) and
DIN 45 633-1 and/or DIN 45 633-2 influenced the CCIR to adopt
quasi-peak
metering.
Fig 2 from
#Wilms-1970.
Wilms on Quasi-Peak Detection
Wilms notes that the DIN 45 405 approach of "quasi-peak" is known as
such because it involves a "fast but finite rise time
specification". This involves a faster rise time than 200 ms
which is used in the other standards, including all the North American
standards to date. He notes that this 200 ms rise time resembles
that of a VU meter. (VU meters were preferred in North American
while Peak Program Meters were preferred in Europe, including the
UK.) He also notes that the CCIR would probably adopt a faster
rise time in the near future. CCIR did so in 1974 with CCIR 468-2.
Here is what Wilms wrote on the history and implementation details of
quasi-peak detectors for audio noise. There are no references for
the 1950 and 1962 dates in the first sentence. The italics are in
the original. The following text appears to contain a recipe for
constructing a
quasi-peak meter
according to DIN 45 633-2 (1968).
I don't yet have a clear understanding of DIN 45 633-1 or DIN 45 663-2,
but I understand
that there are multiple parts and that parts 1 and 2 are separate
standards, or that -2 is an update which extends, but does not replace
-1. That is to say, they are not two editions of the one
standard. So:
DIN 45633 part 1 = DIN 45 633 part 1 =
DIN 45633-1 = DIN 45 633 (1)
DIN 45633 part 2 = DIN 45 633 part 2 = DIN 45633-2 = DIN 45 633 (2)
A correspondent in Germany confirmed that the "-2" is an update to the original "-1":
Once a norm has
been released, there will be no other contradicting versions, only
addendums or corrections will be printed on a new paper with a new
number. So one can refer to the actual norm one is working
with. The papers must be bought because the Institute is paid
from papers sold. Unfortunately one cannot buy single norms, one
must subscribe to a whole book of norms which costs a fortune.
(Pages 652 and 653.)
This German
technique of quasi-peak measurement has been applied in Germany and
some other European countries since about 1950, although the first
standard was not published until 1962.
What was this 1962 standard?
This method takes into account the subjective assessment of reproduced
impulsive noises when listening
to sound programs. A single pulse coming from a little scratch on
a disc surface has a relatively low average level, but is not masked by
the program in mezzo-forte passages. Such pulses are very
annoying when one listens to recorded sound programs.
A similar problem with the slowness of the "fast" rise time exists in
the area of the sound level meters which follow the standards ANSI
S1.4-1961 or IEC 179 (1965). It is well known that a measurement
of the A-weighted sound level (a so-called dBA reading) gives a reading
for impulsive sound sources which is too low compared with the real
subjective results (in phons) determined by means of a listening panel.
There is a new German standard, DIN
45 633, Part 2 (1968) for an impulse sound level meter which
better corresponds to the impulse response of the ear
#Reichardt-1968 seems to
be a paper written about DIN 45 633-2. Please see the 1968
reference for the full title of this standard, as cited by Wilms-1970
as reference 9.
In order to do this, the
signal voltage (proportional to sound
pressure) is squared, averaged with an RC network having 35-ms time
constant, and the square root is taken. Then the peak
value of this voltage is taken with a circuit which charges rapidly
compared to the 35-ms averaging time constant, and discharges with a
long time constant of about 3 s. Thus the actual rise time of the
meter movement itself is not critical, since the peak value of the
signal is "stretched".
Note these 35ms charge and 3 second decay time-constants are the same
as ??????
but different from the "recipe" provided by Vivian Weeks for a
quasi-peak metering system which would comply with CCIR 468-2, -3 or
-4. See 1999.
Several companies have
already built new impulse sound level meters
following this German standard: Brüel and Kjaer (Model 2204); Hewlett
Packard (Model 8052A); and Rohde and Schwartz. An international
standard is still under consideration [
#WG-8-1966].
Note that the commonly used integration time of approximately 200 ms is
similar to that of the VU meter, although the VU meter reading is sound
pressure proportional rather than sound power proportional. On
the other hand, the values specified for the DIN psophometer and the
DIN impulse sound level meter are longer than the 4 to 10 ms currently
used in Europe for peak program meters.
If we compare the weighted readings of the DIN short averaging time
quasi-peak mode and the longer averaging time rms mode, we find that
the quasi-peak readings are some 4 to 7 dB higher (see
#Belger-1953 fig. 9).
Wilms on older standards for Weighting Curves
(Page 653.)
The
use of weighting or psophometric networks for the measurement of audio
noise levels originated with telephone and telegraph companies who
wanted to verify the quality of their lines for speech circuits. With
the use of broad-band lines for transmission of radio programs to
transmitters it of course became necessary to use a different
(wide-band) frequency-response weighting network for the
background noise. History shows that Europe and America have
chosen different ways.
The basic idea was the use of the inverse 30-phon curves of Fletcher
and Munson. When the standard sound level meter became widely
used, its A-weighting network began to be used more and more as a
psophometric network, especially in English speaking countries.
In Europe, the idea of the inverse 30-phon curve was initially adopted;
however, it was later realised there is a difference between the
concepts "loudness level" and "annoyance".
In 1949 the CCIF
specified a different weighting curve,
P
of Fig. 1,
in place of the
A curve.
In this curve the frequencies between 1 and
9 kHz (which are found to be more annoying) are more strongly weighted
than in the "A" curve.
Fundamental work done in the early 1950's by Belger
#Belger-1953
confirms the conclusions reached by the CCIF (now CCITT): the annoyance
of the higher frequencies is even greater than that given in the CCITT
P curve.
After more than 20 years of standardization, it is curious to note that
this P curve was proposed to the CCIF by a U.S. organization, the
American Telephone and Telegraph (ATT) [personal communication with E.
Belger, 1970], [
#Mangold-1952].
Although frequently used in Europe, the
P-weighting curve has rarely been
used in America.
Wilms on Standards Current in 1970, including the 1953 origins of
the "Q" weighting curve which is retained to the present
The "French Committee" (CCIR, I assume) objected to the use of
A weighting in IEC 268-1. The
"1954 CCITT standard" was CCITT P53.
In 1968 the first part of
the extensive IEC standard 268, Sound System Equipment, was published
[2]. In Section 7 this standard recommends the use of the A
weighting
network for the noise measurements. (The French committee
objected to
this at the time.)
In 1970 during the 12th plenary assembly of the CCIR in New Delhi, the
1954 CCITT standard was
replaced by a new standard, CCIR 468 (1970), on the basis of the
results obtained by a special study group (Report 398-1
#CCIR-1970-398-1). This new
psophometric curve, shown as curve
Q
in Fig. l, was first given by Belger in 1953 [
#Belger-1953],
and later proposed to
CCIR by the German committee.
I assume the "German committee" refers to a DIN committee. So it
seems that Ernst Belger first devised the curve, which DIN suggested to
the CCIR 398-1 study group - who recommended what we now know as CCIR
468-1.
It can be seen that
higher frequencies between 1 and 12.5 kHz are more
strongly weighted with a maximum of + 12.4 dB at 6.3 kHz (against +8.4
dB at 5 kHz for the
P curve).
The slope in the lower frequency region is exactly + 6 dB per octave,
which facilitates the construction of the psophometric filter.
Thus, we see that there is a discrepancy between these two
international standards: the IEC [IEC 268-1] has been specifying A
weighting since 1968, whereas the CCIR has now abandoned this response,
and specified the
Q curve
mentioned above. The CCIR Report 398-1
#CCIR-1970-398-1
draws
attention to this discrepancy:
"... the A-weighting
network curve, adopted by IEC TC 29 and ISO TC 43, which is intended
for the measurement of acoustic noise, is not considered suitable for
the measurement of audio-frequency noise in broadcasting and sound
recording systems, as in this case it is the effect of the noise on the
program rather than the loudness of the noise itself which is important
. . . ".
In conclusion, he writes:
(Page 655.)
It appears that a
measurement with the new Q weighting
network together with the faster
time constant (quasi-peak) give the best results with regard to the
annoyance of audio noises.
1972
IEC
268-4 1st
edition, on microphones, is released. This uses A weighting and
RMS metering for its noise measurements. The 1st edition
remained current until the 2nd edition was released in 1997.
Dolby Laboratories conduct a study on
noise measurement, which is the basis for their proposal "CCIR-ARM"
which was written about in their paper of 1978-79. The study
evidently resulted in Dolby producing a weighting filter box and this
being widely used by the company's licensees.
1973
I have found references to
IEC 179A (IEC 179-A) which is
described at
http://www.city.vaughan.on.ca/..../Technical
Definitions Noise Bylaw.pdf
as a "first supplement to IEC 179", concerning impulsive sounds.
One article (Impulse Noise and Risk Criteria, J. Starke et. al. Noise
and Health 2003,
http://www.noiseandhealth.org/...aulast=Starck
) cites it as a 69 page standard "Recommendation for Impulse Sound
Level Meters". Please see 1968 for DIN 45 633-2, which I think is
related to this.
Some details of IEC 179A's requirements, and of a corresponding DIN
standard DIN 45 633-2 (year ???????) can be inferred from this brochure
http://tubeaudio.ru/lab/2607.pdf
for B&K 2606, 2607 and 2708 precision sound level meters.
There are Fast and Slow IEC 179 responses and for impulse measurements,
according to DIN 45633-2 (DIN 45 633 part 2 - 1968) and IEC 179 (on
page 316):
The RMS level of
impulse sound signals is measured with a rectifier circuit having a
rise time of 35ms and a decay time of 3 seconds according to the
requirements of DIN and the IEC Recommendation 179A fr Precision
Impulse Sound Meters. A hold circuit can be selected to capture
transient signals and singe events and a meter reset button is also
provided.
So my impression is that the DIN 45633-2 standard of 1968 was
effectively copied, followed or whatever by IEC 179A in 1973.
Bent F. Hertz presents a paper "A New
Solid State Peak Programme Meter"
#Hertz-1973.
This contains some history and technical details, including of a
proposal for updating the 1965 standard IEC publication number
179 "Precision Sound Level Meters". This proposal presumably
resulted in IEC 179A.
The references in this paper are not pointed to by specific citations
in the text. One of the references is a paper by Ernst
Belger. The journal details come from another source described
below.
E. Belger: Wer misst
Aussteuerung, Störspannungen und Tonhöhenschwankungen richtig.
(Journal details below.)
This translates as
"Who measures correctly disturbing noise and pitch variations", for
which the technical terms are "weighted signal to noise ratio" and "wow
and flutter". Googling the title turns up something
in Google
Books: a reference 207 on page 741 of
Handbuch
der Tonstudiotechnik
by Johannes Webers. Edition 9, 2007 which gave me the journal details:
Kinotechnik (1963), Heft 11, Seite 293. Googling reveals the full
journal name is probably: "Verlag für Radio-Photo-Kinotechnik,
G.m.b.H., Berlin-Borsigwalde, Germany".
1975 and 1976
CCIR 468 amended twice as 468-1 for quasi-peak metering?
It seems there was
an amendment to the original CCIR 468 standard in 1974 to specify
quasi-peak metering. No metering system was specified in the
original. See "1978" for more details.
#Hertz-1977 mentions in his
bibliography two dates for "CCIR 468-1":
CCIR,
Recommendation 468-1 (Rev.76) and 468-1 (1975)
On page 9, following from what I quoted in the 1952 section, Hertz
states:
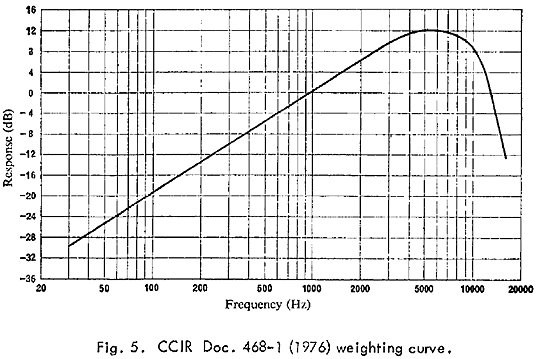
In 1974 the CCIR
recommendation was drastically changed with both a new psofomerter
curve fig. 5 and a decrease in the noise bandwidth for the "flat RMS"
from 23 kHz.
I can't form a clear picture from this about the various forms of CCIR
486-1 in 1974 to 1976.
The measuring after this
new doc. 486-1 (1974) will for white noise give 4.4 dB higher value by
"weighted peak" measurement and 1.2 dB lower by "flat RMS" measuring
compared with the old standard. The difference between "flat RMS"
and "weighted peak" is appr. 11.8 dB.
In the year 1976 CCIR doc 486-1 has, however, been revised as the
demands to Quasi Peak rectifier has been extended with toneburst
measuring down to 1 mS, and the bandwidth for "flat RMS" measurement
has again been increased to 23 kHz equivalent noise bandwidth, though
with a rather big tolerance (+/- 4 kHz +/- 0.7 dB). This new
proposal is names CCIR 468-1 (Rev 76) and is considered valid until the
plenary meeting in 1978, where it probably will be confirmed.
It is to be mentioned, that the above standards are mainly used in
Benelux, Scandinavia and Germany while BBC and IBA in England use CCIR
Rec. 468 weighting curve in connection with the BBC Peak Programme
meter.
The full wording of the new CCIR Recommendation is found in CCIR Doc.
10/247-1 30th June 1976, "Conclusions of the interim meeting of study
group 10 (Broadcasting Service Sound). Geneva 3 - 18 May 1976 part 1".
Besides CCIR and DIN standards, there is an IEC Recommendation 268-3,
which f.i. describes the "A curve" measurement with RMS
rectifier. This measuring method is not often used in studio
equipment and will therefore not be further documented.
Hertz goes on to describe quantitization noise in ADCs and a technique
for measuring it involving one or more "gliding sine waves".
1978
CCIR 468-2 with quasi-peak metering ?????
According to
#Weeks-1999 in 1978 the second
edition of CCIR 468 was released. Like the original, now known as CCIR
468-1, it has the weighting curve identified as
Q in Wilms-1970. In the first
edition, no metering detector was specified.
According to
#Weeks-1999, the
quasi-peak metering system was added in 1974, but this was presumably
via an amendment, rather than a second edition.
According to
#Weeks-1999, in the
second edition, a specific quasi-peak detector behaviour was "first
completely specified". This combination of weighting filter and
quasi-peak detector remains current to the present day (2009-09), via
later editions: CCIR 468-3, CCIR 468-4, now republished as ITU-R 468-4.
The ITU-R 468-4 document appears to be a copy of the 1986 CCIR 486-4
document, which contains a list of years, without further elaboration:
"1970 - 1974 - 1978 - 1982 - 1986". I assume that 1974 refers to
an amendment. The other years clearly refer to the original (-1)
and the subsequent complete editions -2, -3 and -4.
Weeks states that these editions 468-2, 468-3 and 468-4 have not
"introduced any significant modification to the instrument's
performance" and that test equipment conforming to any of these three
specifications "therefore may be assumed to give identical
readings". He also notes that this method "has been used in the
UK since 1979 for most noise measurements on audio transmission systems
by formal agreement between broadcasting and transmission
authorities". I understand this refers to long-distance audio
transmission lines which carry radio program signals from studios to
transmitter sites.
Dolby's "CCIR-ARM" paper
Dolby Laboratories presents a paper "CCIR/ARM: A Practical
Noise-Measurement Method" at the May 1978 AES convention, which is
published in its final form in JAES in March 1979
#Dolby-1978.
This paper argued against the adoption of:
- Unweighed noise measurement of any kind.
- A weighting, with RMS
detection, as used by NAB and in IEC 268-1 (1968).
- The weighing curve described by Wilms in 1970 as P which is used with a quasi-peak
meter by DIN 45 405 (1967).
- The weighting curve described by Wilms in 1970 as Q and as used (??????? detector) in
CCIR 468-1 (1970).
and instead proposed the adoption of a system they named
"CCIR-AMR". This uses the CCIR 468 weighting curve, but with a
different reference level (effectively moved down by ~6dB) and with an
average-reading voltmeter, rather than using RMS or quasi-peak
detection.
The company had been using this approach to noise measurement
internally and with its licensees, and had produced a small filter box
which could be used with generally available average reading
millivoltmeters.
The
A weighting filter was
rejected because it did not adequately represent the human sensitivity
to higher frequency noise, which appears in analogue tape hiss.
Implicitly the deficiency is in the 1kHz or 2kHz to the 12kHz to 15kHz
range. The paper notes that measurements were frequently actually
done with average weighting meters, in spite of the IEC 268-1 standard
requiring RMS.
The DIN 45 405 approach was rejected on two grounds. Firstly, the
curve does not represent higher frequency noise adequately due to its
sharp 9kHz cutoff. The paper notes that this curve was developed
in the 1940s for communication systems having sharp cutoff
properties. There is a note that the DIN 45 405 (1967) standard
is "officially obsolete" - which looks wrong to me. There is a
note that a proposed standard DIN 45 500 (April 1975) uses
A weighting, making it compatible
with IEC 268-1.
The critique of DIN 45 405 included the first of several references to
noise figures which were argued to be commercially unappealing or
unacceptable due them being ~6dB or so worse than those resulting from
the most widely used approach: A weighting with RMS detection.
The implication is that equipment manufacturers given the choice of
several noise measurement techniques will tend to choose the one which
provides the lowest number.
The DIN 45405
method did not achieve widespread usage because the numbers yielded
were unappealing (some 6 to 8 dB worse than unweighted) and also
because of the high cost of the complex meter required. For many years
it was available from only one manufacturer (Sennheiser).
Dolby's critique of CCIR 468-1 and the conclusion of the critiques are
quoted in full below:
At the time of our
investigation in 1972 it happened that the whole subject of noise
measurement in audio equipment was under review by the CCIR. The
evidence presented in study program 2A/10 included the results of
measurements using various techniques on different kinds of noise in
comparison with their obtrusiveness.
This information led to a fairly clear-cut optimum system, that which
the CCIR subsequently adopted unanimously (Recommendation 468-1).
This system is very satisfactory technically and for research purposes,
but retains the other disadvantages of the DIN 45405 method; it uses
the same expensive quasi-peak instrument and gives figures apparently
inferior to those being published in the specifications of audio
products (by 10 or 12 dB).
The CCIR was of course trying to standardize on a technique applicable
not primarily to commercial audio equipment but to broadcasting,
including landlines and multiplex carrier systems. The method
therefore had to give accurate results on impulsive noises, distorted
crosstalk, dialing clicks, whistles, etc., and required the quasi-peak
meter to do so.
Conclusions
Thus our 1972 review of the available methods showed that none of them
fulfilled our requirements for a practical system. Both DIN and CCIR
weighting essentially met the technical requirement of correlation with
subjective assessment but notably failed the other conditions, being
expensive and giving answers which sounded commercially disastrous in
comparison with unweighted ones.
Fig 1 of this paper depicts the A and DIN 45 405 (Wilms' P curve)
together with a third curve representing the newly proposed (actually,
from 1972) weighting curve: "CCIR/ARM":
Not shown is the true CCIR 468-1 curve (
Q
in
#Wilms-1970
) which is about 6dB higher than the so-called CCIR-ARM
curve. The 468-1 curve, as is usual for weighting curves,
has its 0 dB reference at 1kHz. The Dolby curve has its reference
at 2kHz - apparently for the sole purpose of producing numerically
lower results.
This paper does not explain why quasi-peak metering is expensive.
This expense purely affects test-equipment, which represents a very
small part of the total cost of producing audio equipment, especially
mass-market consumer hi-fi and professional audio equipment.
Dolby's criteria for choosing a noise-measurement system are quoted in
full below:
The need was for a method
of measuring and comparing normally encountered noises in professional
and consumer audio systems -especially amplifier noise, tape noise, and
FM noise. We felt that, as a practical matter, such a method and
the equipment to implement it could come about only if several
conditions were fulfilled:
1) To be purchased, it must be inexpensive.
2) To be technically useful, it must give relative numbers which
correlate well with subjective noise comparisons made under real
listening conditions.
3) To be commercially acceptable, it must yield absolute numbers which
are familiar sounding (for example, it would not be acceptable to have
a method which gives a dynamic range of 50 dB for a professional tape
recorder).
Only if these conditions are met does any method stand a chance of
being accepted and used widely, regardless of the degree of official
standardization.
I think few people would debate Dolby's arguments against no weighting,
A weighting or the DIN 45 405 (P) curve. The objections to the
CCIR 468-1 approach can be summarized:
- The quasi-peak metering system, although technically excellent,
is prohibitively expensive and is (implicitly) not needed in
professional or consumer audio testing, since it is really only needed
when the noise contains significant impulsive elements.
- The noise numbers produced by CCIR 468-1 are so much higher than
those for A weighing and RMS detection that few companies would want to
publish these figures.
The solution was to retain the CCIR 468 weighting curve, but to use
essentially zero-cost average metering and then to ensure the figures
the new system produces are not much higher than those resulting from A
weighting and RMS detection.
Part of the reduction is due to the average meter producing a lower
reading for a given random noise signal than a quasi-peak meter.
The average meter's output would also be lower than that of a true RMS
reading meter.
The other part was achieved by simply jacking the curve
downwards. The formal arrangement was not an integer number of
dB, but the 5.6 dB needed to make the curve read 0 dB at 2 kHz instead
of 1 kHz.
For the future, a further modification to CCIR 468-1 is suggested:
The CCIR/ARM method
could in due course be made part of a unified measurement standard.
This would entail redefining the quasi-peak reading instrument
required by CCIR recommendation 468-1 so that it is scaled to give an
apparent sensitivity 11 dB lower; the CCIR method would then give the
same answers as CCIR/ARM on the types of noise for which the latter is
intended.
The paper includes a schematic and explanation for a transistor-based
filter. 7 LP filters are followed by a single HP stage, with a
little "feed forward" (R8) to "increase the attenuation in the 9kHz
area".
The paper lists about half a dozen test equipment manufacturers who
have implemented the new system and goes on to suggest that "CCIR/ARM"
is:
. . . well on the way to
becoming a de facto
standard used in many areas of professional and consumer audio, in both
research and commercial applications. In due course we would
expect to see formal recognition of this situation.
One step toward official acceptance has already been made. An
SMPTE subcommittee on Audio Recording and Reproduction has approved a
draft standard using the CCIR/ARM method for the measurement of noise
on optical soundtracks [SMPTE Draft of ANSI Standard A12 65-444, The Method of Measurement of the
Signal-to-Noise Ratio of 16-mm and 35-mm Variable Area Photographic
Sound Records].
After ratification, this standard will emerge, and in due course will
probably become an American National Standards Institute (ANSI)
publication.
Using the Dolby approach, with its average responding meter, seems a
curious choice to me for this application, where scratches and dust
lead to impulsive noise. This difficulty was mentioned in an
earlier passage. The bold emphasis is mine.
While not
originally envisaged for the purpose, the method has also been used to
measure and compare noise levels on optical sound tracks.
No problems have been found if the
print is in reasonably good condition and is not extremely dirty or
scratched; such defects lead to impulsive noise. We do not have any
experience of disk noise; it is probable that considerations similar to
those of optical noise are applicable.
My summary of the current undesirable situation
The above text highlights the problem I perceive with any noise
detection arrangement which does not use a carefully crafted quasi-peak
detector, no matter how good its weighting curve is:
Systems which use RMS or worse-still
average metering will only produce valid results as long as the noise
is not contain audibly impulsive elements.
Therefore, while such systems can be applied to any signal, there is no
objective way of telling whether the resulting figure is valid.
We are left to trust the judgment of the engineer who chose to use
this RMS or average responding system that the noise in question did
not contain any significant impulsive components.
Worse still, since some audio systems do have impulsive noise, this
means that if Dolby's proposal was widely adopted, that there would
still need to be CCIR 468 meters in use, with some items of audio
equipment having noise figures calculated by this comprehensive system
and the remainder using the simpler system. Since the numbers
produced by the two systems will not be the same for any one noise
signal, this would lead to further confusion for everyone.
In late 2009, it seems this is what we have: some people use A
weighting with RMS detection, some use Dolby's so-called CCIR-AMS
system and others use the true CCIR-486 system (the standard has been
superseded by others with the same technical characteristics).
To me and a number of other people, Dolby's concerns about test
equipment costs and numerically larger noise figures are
inconsequential and do not at all justify the introduction of this
"CCIR-AMS" system to further muddy the waters as the industry should,
ideally, to our way of thinking, be abandoning A weighting and
unweighted noise figures and adopting CCIR-486 as the sole method of
measuring background noise in acoustic settings where human perception
is the most important concern.
Tomlinson Holman's "Noise in Audio Systems"
Tomlinson Holman, of Apt Corporation, Cambridge Massechusetts,
presented a comprehensive 22 page paper "Noise in Audio Systems".
#Holman-1978 This contains lots of
discussion about weighting curves and detector systems.
He presents a graph showing the CCIR-468 curve moved down by 6dB,
according to the Dolby proposal discussed above. Here are some
quotes:
There are two widely-used
weighting responses for psychometric assessment of noise. The
most universal of these is the "A" weighting function which was based
on an early 40-phon contour. In recent years, the response
CCIR-468 has come into prominence as being allegedly in better
alignment with perceived noisiness.
Figure 9 shows four curves: the Stevens and Kryter psychometric
responses along with the A and CCIR weighting curves.
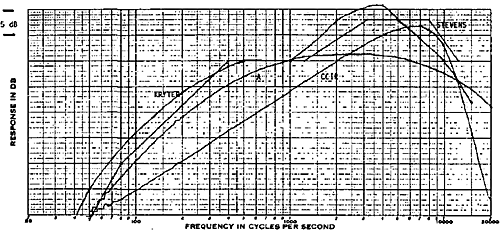
The level for the CCIR
curve has been adjusted downwards by 6 dB following the practice
proposed by Dolby Laboratories. (This adjustment is for the difference
between average and peak reading instruments; more about that later.)
The A-weighting response can be seen to be more accurately aligned to
perceived noisiness below l kHz than the CCIR response, while above l
kHz the mid-frequency bulge of the response curves is followed more
accurately by the CCIR weighting.
The steep rolloff of response above 10 kHz in the CCIR weighting
function was probably incorporated because the function was intended
for broadcast applications with a high-frequency bandwidth limit of 15
kHz: none of the available information on perceived noisiness at
high frequencies shows such a sharp response rolloff.
The nature of the response in the top octave is especially important
with magnetic coil input transducers, since a resonance arises between
the inductance of the coil and the load capacitance and resistance
which causes a peak in the noise spectrum in the 10 - 20 kHz
octave. The Stevens and Kryter functions appear to be rolling off
at about 12 dB/octave in the top octave, while the CCIR response is
rolling off at 24 dB/octave,and the A weighting response is rolling off
at an ultimate 6 dB/octave.
On detector systems, he writes:
The type of detector
circuit employed in the measuring equipment also influences the
reading. Although average, RMS, and peak detectors may be
calibrated to read identically on sinusoidal waveforms, they will not
read the same on noise.
The average-responding, rms calibrated detector (which is the common
type employed in ac millivoltmeters) will read approximately 1 dB less
than a true-RMS-detector-equipped meter. A peak responding
detector will read from a few to many dB greater than a true RMS type,
depending on the time constants of the detection circuitry.
The speed of response of the detection circuitry is relatively
unimportant for well-controlled noise sources, such as those usually
found in electronic equipment, but for spike-shaped noise sources, the
time constants become very important.
The CCIR standard calls for a quasi-peak detector with meter response
to tone bursts of various lengths specified to obtain consistent
measurements. Unfortunately, instruments meeting this standard
are apparently expensive to make, as they currently cost upwards of
$2000. The use of the CCIR weighting curve with a conventional AC
millivoltmeter, as proposed by Dolby Labs, has therefore the great
advantage of low cost.
He then discusses loudness measurement according to the work of
Eberhard Zwicker.
1983
DIN
45405
was updated on 1983-11-01. There do not seem to be specific
version numbers, but in 2009-09, this 1983 version was still current at
DIN. A 2008
list
of standards includes the following:
Bezeichnung: DIN 45405
Titel: Störspannungsmessung in der Tontechnik
Ausgabe: 1983-11-01
(vorges.) Ersatz: DIN 45405 1967-07-01
"Ersatz" means "replace". Although the standard is in German, its
English title is
Noise Level
Measurements in Sound Systems. In 2009-09 it is one of 342
standards issued by DIN committee DKE/K 742.
I purchased a copy. It appears to be a replication of CCIR 468-4,
but without any circuit diagrams. The standard is dated November
1983 and at the top right corner has a space between the numbers: DIN
45 405. The introductory sentence, in German, and via a rough
translation is:
Diese Norm stimmt
sachlich überein mit der CCIR-Recommendation 468 "Measurement of
audio-frequency noise in broadcasting, in sound recording systems and
on sound programme circuits".
This standard agrees objectively with
the CCIR Recommendation 468 "Measurement of audio-frequency
noise in broadcasting, in sound recording systems and on sound
programme circuits".
I think this is based on CCIR 468-3, which I think is from 1982.
The original printing of CCIR 468-3, as included as Appendix 1 of IEC
268-1 2nd ed. (1985) contains erroneous figures 44 and 50 in table 2,
at the top of the 50 and 100 ms % lower limited values, whereas the
correct values are 50 and 58. The correct values were given by an
IEC amendment 1 in 1988, but DIN 45405 of 1983 has the correct values.
1984
Gerhard Steinke's "Important CCIR-Standards for the Audio-World"
Gerhard Steinke, in
#Steinke-1984, reports
on
CCIR 468-3. His
affiliation is with the East German
RundFunk-
und Fernsehtechnisches Zentralamt der
Deutschen Post, Berlin and he is chairman of CCIR working group 10-C,
which is concerned with the audio frequency characteristics of sound
broadcasting signals. The measurement of noise voltage is
"the most essential part" of 10-C's work.
The work of the C.C.I.R.
(International Consultative Committee of the International
Telecommunication Union, Geneva) has been unknown to many audio
engineers.
In publications, i. a. in the J.A.E.S., the results of the CCIR, in the
field of audio techniques as well as in subjective quality assessment,
are seldom mentioned. In the field of entertainment (home)
electronics and high fidelity techniques the work of the IEC
(International Electrotechnical Commission) is better known. But
the results of the CCIR are relevant to the field of studio techniques
in general, the parameters of which formerly were higher by some orders
than those applied for entertainment electronics. The rapid
evolution of electrotechnice, especially the coming of digital
technique, makes this difference more and more diminish.
(I wonder whether distance, language and cultural differences - and
cold-war tensions - have contributed to CCIR / ITU standards
being less accepted in North America than they otherwise might have
been. I think "i. a." means
inter-alia
- "among other things".)
This paper includes the essential text, graphs and diagrams of CCIR
468-3, with some notes of interest, including the following.
Weighting curves
The argumentation for the
fundamental characteristics laid down in recommendation 468-3 is
contained i. a. in report 398-2 (1974) Geneva [
#CCIR-1974-398-2].
According to this, the best agreement between measurements of the
audio-frequency noise and the subjective assessment is obtained with
the help of a modified version of the sound level meter by Niese [
#Niese-1958]
and a weighting curve according to fig. 1 (lb) in Rec. 468-3.
This is confirmed by studies conducted in Great Britain and the Federal
Republic of Germany, the German Democratic Republic and some other OIRT
member countries.
Concerning the
weighting
curve
an immediate agreement was possible among the organisations
participating in the CCIR. The noise should be weighted with high
quality sound reproduction in conformity with ear response
characteristic and noise impression; therefore, the curve according to
fig. 1 (lb) is incontestable.
The curve which the IEC prepared for purely acoustical purposes, namely
for the loudness of noise (background noise, interfering noise), (the
so-called curve
A) proved to
be unsuitable because when weighting electroacoustical transmissions or
recordings, annoyance as well as masking effects are far more
predominant.
Comprehensive tests have shown - as is pointed out in CCIR Report 398-2
- that curve
A
produces large errors, in case that certain types of noise prevail
particularly with wide bandwidth circuits having frequency responses up
to 15 kHz and with impulsive type noise. Furthermore the
weighting of the noise voltage level is based on special listening
conditions (high quality broadcasting listening room, see CCIR report
797-1 or OIRT Recommendation 86/1, together with studio listening
equipment), where the noise level is lower than that used in curve A of
the IEC (30 dBA).
I notice two things here. Firstly, the tests were done with
loudspeakers ("listening room") and secondly the bandwidth of the
system was assumed to be limited to 15kHz.
My personal experience is that as an adolescent, I could hear to
17kHz. Considering the listening audience for much music and
other program material in recent years includes adolescents using
in-ear headphones, it could be argued that this curve would ideally
extend beyond its current sharp cutoff around 15kHz.
Considering that
presently no international unified reference listening equipment exists
and hence the frequency response of the sound pressure is not defined
at the listener's place, the frequency weighting curve for noise
voltage measurements should suitably be related to a
frequency-independent sound pressure.
As compared with the former weighting curve P 53 of the CCITT, there
are differences in the measurement results because of the fact that the
higher frequencies are now more emphasized. With quasi-stationary
or stationary signals, the difference between the "former" (P 53) and
the "recent" noise voltage values (Rec. 468-3) is about 5 to 6 dB, i.
e., the signal-to-noise values are lower by this value than they were
formerly.
This seemingly "deterioration" of equipment has aroused a certain
concern among the manufacturers of broadcasting receivers, but with
pertinent explanation and correct complete indication of the values no
problems should be left.
The experienced engineer is not interested in "nice figures". The
proposal by R. DOLBY, to maintain the numerical values hitherto used in
approximation in that the reference frequency of the filter is
increased from 1 kHz to 2 kHz /4/, was not accepted by the CCIR.
Within the high-quality studio suite, complications and errors would
result therefrom, e. g. on account of the different preemphasis and
deemphasis characteristics of the networks in the transmission path, of
the different conditions of measurement etc.
Quasi-peak metering
But the weighting curve
is only one factor to be considered. The
temporal weighting is also
a decisive magnitude.
As said above, the CCIR was of the unanimous opinion (1974) that the
temporal weighting according to Niese [See graphic below - maybe Û
t
~ 23ms] [
#Niese-1958]
gives the best agreement agreement with subjective values with the
largely differing interference noise (see figure 3 from [
#Steffen-1972].
Nevertheless, the CCIR decided already in 1974 unanimously in favour of
quasipeak value measurements for the following reasons (see Report
398-2):
- the instrument would not be expensive;
- its use would be less fatiguing than most of the others;
- measuring devices of this kind have successfully been used in
many countries for several years,
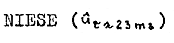
The above, and the following, seems to indicate that Niese developed a
noise detector which the CCIR judged to be superior to the quasi-peak
detector they chose for 468-3, and that in the future, when digital
technologies became more available, that perhaps the Niese detector
could be implemented.
Therefore, it was
unanimously felt that the recommendation of a different type would have
been advisable only if it had properties which could compensate for the
economical advantages of the recommended quasi-peak instrument. From
this it can be concluded, however, that the NIESE weighting may get
some importance again, when the electronic circuitry is further
developed, economic solutions and general experience in the use of Rec.
468-3 for digital technique will be gained.
He continues to discuss the need for quasi-peak metering:
Rec. 468-3 excludes the
use of RMS value measurement as it is not intended for the measurement
of quality parameters. Quality assessments may correctly relate
only to the subjective noise impression. Insofar it is not always
reasonable to differentiate between studio quality and Hi-Fi quality
(entertainment electronics); on the contrary, the buyer is mislead by
the seemingly "favorable" figures of an RMS value measurement.
The situation is another one, when due to unsufficient quality of
transmission paths (e. g. in telephone lines), the measurement of
quasi-peak values leads to non-constant and reproducible measured
values on account of stochastic-type interference. In the case of
series production and checking of apparatus with short checking times
by automatic measuring appliances it may be advantageous too to use,
for type acceptance tests, also RMS value measurement (weighted and
unweighted) in addition to noise measurements. For this purpose,
however, separate standards should be laid down, which have no
reference to Recommendation 468-3.
If, for certain reasons, measurement of unweighted quasi-peak value
measurements should be required, it would be suitable to apply the
curve (see fig. 4) given in Rec. 468-3, annex II for a "standard
frequency response". (But annex II is no more part of the competence of
Rec. 468-3!).
On the how measurements vary with weighting filter and detector system:
In practice, if white
noise is used with a bandwidth of 15 kHz, the following differences in
the measured results [
#Jakubowski-1980]
are obtained:
- between RMS value measurements and quasi-peak value measurements:
approx. 4 dB.
- between the measurements weighted according to Rec. 468-3 and
unweighted measurements: approx. 8.5 dB.
- from this it follows that we obtain between unweighted RMS value
measurements and weighted quasi-peak value measurements: approx. 12.5
dB.
Likewise, in case of RMS value measurement according to the IEC-curve
A
as compared with the quasi-peak value measurement according to
CCIR-468-3, a difference of 10 to 14 dB exists depending on the signal
spectrum.
H.A.0. WILMS [
#Wilms-1970] meanwhile
suggested to complete these indications for further discussions by
measurements with red, pink and "green" (IEC loudspeaker test signal)
noise and different time constants. On this subject, we can
report only at a later date.
In addition, H.A.O. Wilms pointed out to remember that the measurement
technologies of sound level meters, peak programme level meters (see
para 3.2) and noise voltage meters exhibit certain relationships which
would question the solutions hitherto achieved (e. g. with regard to
time constants) and require a reconsideration. It should be the
concern of the various international bodies (CCIR, IEC, OIRT, EBU, AES)
to deal with these suggestions in a coordinated effort. This
would also be advantageous for the world-wide use of the CCIR
Recommendation 468-3, and not only in broadcasting and television
studio technique.
.
1985
IEC
268-1 2nd edition is released,
using the same weighting curve ("Q" in Wilms-1970) and the same
quasi-peak metering circuit as was then specified in CCIR 468-3.
In 2009-09, this remains current and is known as
IEC 60268-1 Ed. 2.0. Sound System
Equipment, Part 1, General. The first few pages are
available as a
preview.
This 2nd edition of 1985 replaces IEC 286-1 (1968) and its three
supplements: 268-1A (1970), 268-1B (1972) and 268-1C (1982).
According to
#Weeks-1999, IEC
268-1 2nd edition was in effect copied into the British Standard BS
6840-1 (6840: Part 1) in 1993.
1986
In 1986, the most recent (as at
2009-09) version of CCIR 486 was released:
Recommendation 468-4
(1970 - 1974 - 1978 - 1982 - 1986)
The CCIR, CONSIDERING
(a) that it is desirable to standardize the methods of measurement of
audio-frequency noise in broadcasting, in sound-recording systems and
on sound-programme circuits;
(b) that such measurements of noise should provide satisfactory
agreement with subjective assessments, UNANIMOUSLY RECOMMENDS that the
noise voltage level be measured in a quasi-peak and weighted manner,
using the measurement system defined below:
There is no recipe or circuit for constructing the quasi-peak detector,
but there is a note that two circuits (I would think diode ->|-
capacitor || resistor to ground) circuits could be connected one after
the other:
After full wave
rectification of the input signal, a possible arrangement would consist
of two peak rectifier circuits of different time constants connected in
tandem [CCIR, report 10/28 1974-78].
There is an undated
article
at Lindos Electronics which also mentions a two-stage approach.
This company, under the direction of Peter Skirrow, develops software
which implements this quasi-peak algorithm, so the comment is
presumably well informed:
Rather than having
a simple 'integration time' this detector requires implementation with
two cascaded 'peak followers' each with different attack time-constants
carefully chosen to control the response to both single and repeating
tone-bursts of various durations. This ensures that measurements on
impulsive noise take proper account of our reduced hearing sensitivity
to short bursts.
1988
ITU-T J.16
Measurement of Weighted Noise in
Sound-Programme Circuits is released. A 1993 version is
freely available at
http://eu.sabotage.org/www/ITU/J/J0016e.pdf
(and in rough text and Postscript as 3_6_05 at:
http://stuff.mit.edu/afs/net/dev/reference/ccitt/1988/
).
This consists of a direct copy of CCIR 468-4 of 1986. It is the
same as the version I bought from the ITU, except that this J.16 copy
has a little extra information - that the extraordinarily elaborate
circuit "constant current realization of the weighting circuit"
was developed here in Australia.
1980s
Richard Lee has informed me that during the 1980s (maybe
before and after) that in the UK, Germany and I think other European
countries, it was common to use the CCIR 468-4 filter, but with a BBC
PPM, rather than the quasi-peak meter. To do: confirm this and
get a more exact description.
1990
According to
#Weeks-1999 (page 7-33),
CCIR 468-4 was released in this year. Weeks cites it as: CCIR
Recommendation 468–4, Measurement of
Audiofrequency
Noise Voltage Level in Sound
Broadcasting. In: Green Book, Vol. X, Part 1, CCIR, Geneva
(1990). This was retitled in 1994.
1994
According to
#Weeks-1999 (page 7-33),
CCIR 468-4
was retitled: ITU/R Recommendation BS 468–4:1994
1997
IEC
268-4 2nd edition (microphones) replaces IEC 268-4 1st edition
(1972). The 2nd editions section 16: Equivalent sound pressure level due to
inherent noise uses CCIR 468-3 weighting (the "Q" curve in
Wilms-1970) and quasi-peak metering.
It does this by reference to IEC 268-1 (2nd edition, with two
amendments in 1988) which contains, as an appendix, all the details
from CCIR 468-3.
After this was released, IEC standards had 60000 added to their
numbers, so the above became IEC 60268-4 2nd edition.
The 2nd edition was replaced in 2003 with a 3rd edition, which switched
to A weighting with quasi-peak metering.
Stephan Peus' paper "Measurements on Studio
Microphones"
Stephan Peus (Neumann) wrote a paper [#Peus-1997]
which includes a history of noise measurement standards, with
particular reference to using these to determine the equivalent
acoustic noise level of microphones. There are other items of
interest regarding microphone testing which I have not quoted.
The quotes below concern noise weighting and detection in general.
Unlike many of the papers cited here, which are only obtainable from
the AES E-library, a version of this is available freely on the Neumann
website.
Some quotes from Section 3 on self-noise:
3.2.1. DIN 45 405
In 1962, the German standard DIN 45 405, "Geräusch- und
Fremdspannungsmesser für elektroakustische Breitbandübertragung"
("Noise level measurement in sound systems") was published. This
standard (last edition: 1967) defined, among other things, the
weighting curve shown in Figure5 (a) and a "quasi peak meter".
Therefore, many data sheets from European manufacturers include the
remark 'DIN 45 405, quasipeak' for the self-noise level.
From November1983, this weighting curve in DIN 45 405 was changed as
shown in Figure 5 (b), and thus brought in line with CCIR
Recommendation 468.
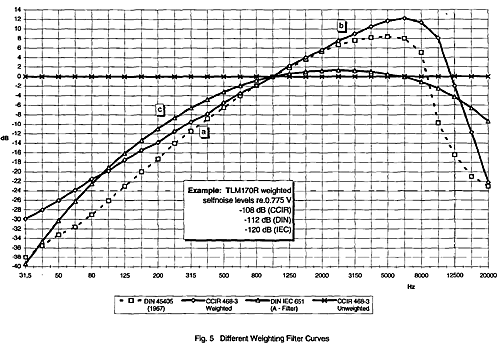
As a result of the
stronger weighting of noise spectrum above 1.5 kHz, the self-noise
level
of a microphone appears to be inferior by about 4.4 dB. [Michael
Dickreiter, Handbuch der Tonstudiotechnik 1/2 Amazon
link
.] When DIN 45 405 is quoted, it is important to note when the
respective
details were prepared. This also prevents
potential misinterpretations when comparing older technical data with
those
for more recent products.
3.2.2. CCIR 468
Reference to CCIR 468-3, on the other hand, is unambiguous and refers
to
the weighting curve shown in Figure 5 (b) and the use of a 'quasi
peakmeter'. More recent data sheets sometimes define such values
as
'weighted peak' or as 'dBq'. Use of an RMS meter,which does not
conform to the standard, produces measuring results which are about 4
dB
lower, and therefore apparently better.
3.2.3. IEC 179 and DIN IEC 651
Completely different measuring results, but again results that appear
to be more favorable, are achieved by using the standards IEC 179 and
DIN/IEC 651. Here, the
weighting curve shown in Figure 5 (c) is used, known as the
'A-weighting'. The noise voltage is measured as an
effective value, not
as 'quasi peak'.
For a microphone, this leads to self-noise levels which
are 11to 12 dB lower than when measured according to CCIR 468-3. To
compare measuring results according to the different standards, Figure
5
shows the corresponding values
for a studio microphone.
Figure 5 shows CCIR-486-2 "dBq" self noise figures for 12 studio
condenser microphones alongside their figures for DIN/IEC 651 "db-A"
(A-weighting and RMS detection). 7 of the former are 11 dB
higher, 4 are 12 dB higher and one is 9 dB higher.
1999
Vivian Weeks provides a comprehensive
description of many audio standards, in
#Weeks-1999
in the
Audio Engineer's Reference
Book 2nd ed. His "recipe" for constructing a quasi-peak
metering system to comply with CCIR 468-2, 468-3 or 468-4 is (page
7-31):
(1) an input amplifier
with adjustable gain, incorporating selectable weighted and unweighted
frequency characteristics;
(2) a full-wave rectifier;
(3) an integration circuit, of charge time-constant of 1.6 ms, and a decay time-constant of
390 ms;
(4) an averaging circuit with a time constant of 150 ms;
(5) a drive amplifier for a display indicator, preferably having a
logarithmic characteristic; and
(6) a display indicator having a calibrated scale range of at least 20
dB.
Consideration of the time-constant section shows that an isolated
short-duration transient may charge the first section to nearly full
amplitude. However, transfer of this pulse through the averaging
stage results in significant loss of amplitude. The resulting
reading for a single transient is therefore "weighted" to reflect the
diminished audible effect.
The presence of a train of transients, each identical to the single
transient postulated above, causes the averaging stage to charge to a
value closer to the theoretical
maximum. The higher reading then reflects the severity of the
audible effect and the consequent increase in annoyance factor.
Obviously, the amplitude, duration and repetition interval of
transients can be infinitely varied. The time constants have been
contrived to give the best
overall correlation with the subjective annoyance to the listener.
It is not clear to my why one would
bother with a separate R-C filter with a time constant of 150 ms except
to avoid driving a physical meter movement with short pulses resulting
from the rapid (1.6ms) rise time of the first section. If this
description is valid, then taking the long-term (say 2 second or more)
average of the output of the second stage would produce identical
results to doing the same for the output of the first stage
alone.
So, for generating a single reading from multiple seconds of audio,
perhaps we should simply take the average of the first section.
On reading the metering system, Weeks describes a technique which I
think is not part of the CCIR 468 or any other standards, and would
produce more than a single numeric result:
Where the measurement
system is incorporated in automatic data-logging equipment, a practical
approach is to store noise readings every 100 ms, say, for the duration
of the measurement period, e.g. 5 s. The print-out should include
both the maximum reading and the average of the readings, comparison of
these figures giving a valuable indication of the transient content of
the noise signal.
This raises an interesting question. If the noise is generally
quiet, but on average every minute there is a loud spike of noise, how
does one generate an "average" noise figure.
A more thoroughly detailed specification would specify exactly how to
create a single figure from an audio signal, such as how many seconds
to measure, how to generate the single figure etc. For instance
if ten 10 second measurements produced values with significant
variation, with, on average, one such value being significantly worse
than the rest, then it would not be realistic to report the average of
the dB values as the final result.
Weeks cautions against confusing the Dolby (1978) so-called CCIR-ARM
method with the CCIR 468-2/3/4 method. He also states:
The current
editions of DIN 45405 and CISPR Publication No. 6 specify instruments
which are essentially the same as the Recommendation 468 instrument.
CISPR (
The International Special Committee on
Radio Interference) is part of the IEC. According to the IEC list
of withdrawn publications, CISPR 6 was published in 1976 and withdrawn
in 1977, and is replaced by CISPR 16-1 (1993). It seems that the
most recent (2009-09) such document is CISPR
16-1-1, (1st edition, 2003).
In 2009-09, DIN 45405 (Noise level measurement in sound systems) is
available from DIN and is unchanged from 1983-11.
2003
IEC 60268-4 3rd edition (microphones)
is released. Amongst the differences is the requirement for "A"
weighting, with quasi-peak metering. This combination had never
been used or suggested by anyone. According to the AES SC-04-04
meeting
notes of 2005-10:
It was noted that
the IEC standard contains an error, referring to a combination of
weighting curve and detector type that is not practical. It was felt
that this was probably due to a compilation error of the current
standard.
The 3rd edition is current in 2009-09 but a 4th edition is close to
being finalized. A draft of the 4th edition (available to members
of AES SC-04-04) shows that weighting will be according to the
psophometric curve ("Q" in Wilms-1970), as specified in IEC 60268-1,
which includes the text of CCIR 468-3.
2010
IEC 60268-4 Microphones Edition 4.0 is released, replacing the 3rd edition of 2004.
I have not seen this, but I am reliably informed that in the section
called (at least in the 3rd edition) "Equivalent sound pressure level
due to inherent noise" that the quasi-peak method is now the required
method of measurement. I am informed that it "now requires 468-4 and has db(A) as optional, rather than the other way round as it had been for a few revisions."
This is a major step forward in encouraging microphone manufacturers to
use the quasi-peak technique when specifying the microphone's inherent
self-noise in a manner which properly reflects how it disturbs human
listeners.
Origins of the 468 weighting curve and
quasi-peak detector
At some stage, once I have an English translation of
#Belger-1954, I will review all this material and attempt to trace these events.
Major Standards
In the following section, the only
standards which really matter are CCIR 468-4 and those which cite it,
or include its provisions. These are the "current"
standards. In the "historical" section are other standards which
were either unrelated to CCIR 468-4, or which lead to its development.
In the "current" standards section I also discuss the various dBxxx
terminologies which may be used to denote particular noise measurement
methods.
Historical
...
Current
...
Viewpoints
I can quote your viewpoint here, or
link to it somewhere on the Web.
My viewpoint is on a separate page:
vp-rw/ .
Links
Flutter
A related question of trying to measure audio impairment in a way which
reflects human subjective experience concerns flutter (rapid pitch
variation). Fortunately this is not a problem with digital
systems. A review of the work in this field is:
Development
of a Standard Measurement to Predict Subjective Flutter McKnight, J. Ampex Corporation,
Sunnyvale, CA, USA IEEE Transactions on Audio and Electroacoustics, Mar 1972, Volume: 20, Issue: 1
pp 75- 78. The IEEE link is here
and the paper is freely available here: http://recordist.com/studer/FlutterReferences.pdf
This paper refers to a 1958 paper by Ernst Belger on flutter
measurement:
On
Measuring Frequency Variations
Ernst Belger, Institute fur Rundfunktechnik, Hamburg, West Germany
IEEE Transactions on Audio and Electroacoustics, Mar 1972, Volume: 20, Issue: 1
pp 79 - 80
Translated by E. Skov (formerly of Ampex Corporation) from
Rundfunktechnische Mitteilungen, vol. 2, no. 4, pp. 168-169,1958;
edited, revised, and updated by J. G. McKnight. (A reference
elsewhere gives the original title: Zur
Messung yon Tonhoehenschwankungen.
This is also included in the FlutterReferences.pdf mentioned
above. There's nothing in these papers of direct interest to
audio noise measurements, but it does give a full institutional
affiliation for Ernst Belger, at least in 1958.
Ernst Belger
I am keen to find out more about Ernst Belger. The above paper
lead me to search for
Belger
Rundfunktechnik to find out more about this researcher. I
found the following:
This contains a photo, from which I created the above somewhat
retouched image, and the following biography:
Ernst Belger was born in
1916 in
Hamburg, Germany. He studied physics at the University of
Tübingen and the Technische Hochschule of Hannover and received the
degree of Diplom Physiker. In 1949 Mr. Belger joined the
Nordwestdeutscher Rundfunk in Hamburg as a development engineer.
Since 1957 he has been responsible for sound recording and
psychoacoustics at the Institut für Rundfunktechnik, Hamburg. Mr.
Belger has published numerous papers, most of them concerning the
influence of transmission links on the quality of broadcast programs
and corresponding measuring techniques.
One paper he co-authored is cited (ref 10) in the BBC's 1967
report
on digital audio (Pulse-code modulation for high-quality sound-signal
distribution ...":
Belger, E., Pavel, E.A.,
and Rindfleisch, H.1955. Über den
Einfluss von Laufzeitverzerrungen und Frequenzbandbeschneidungen bei
der Übertragung von Rundfunkdarbietungen, Fernmeldetech Z.
1955, 8, 8, pp.445 - 455. (Tr: On
the influence of group delay distortion and frequency range (bandwidth)
limiting in the transmission of broadcast presentations.)
The full journal name is : "Fernmeldetechnische Zeitschrift"
(Telecommunication Technology Magazine). These can sometimes be
found in libraries in Germany, I guess, and original copies can
sometimes be found via eBay and
http://www.bookfinder.com.
References
These are papers - this list does not
include standards. Many of these documents are only available at
the AES E-library, which costs USD$125 a year to access.
Steudel-1933 Ulrich-Steudel-1933-graphic-scan.pdf (13 pages.) Steudel,
Ulrich: Über Empfindung und Messung der Lautstärke
(On the feeling and measurement of loudness), Hochfrequenztechnik und
Elektro-Akustik 41, [1933] booklet 4. S.116. I listed this title as "Über die Empfindung . . ." but in June
2014 I received a graphic scan of this article, thanks to a researcher
finding it in the Library of Congress and now know the title does not
contain "die". #Belger-1953 cites this article extensively and erroneously states that it is from 1937.
Another citation may be: Steudel. U. 1933 Über die Empfindung und Messung der
Lautstärke. Zeitschrift fur Hochfrequenz Technik und Electrotechnik 41: 166 ff. A Google Books page has a somewhat different citation: Title:
Über Empfindung und Messung der Lautstärke; Author: Ulrich Steudel; Publisher: Akad. Verlag-Ges., 1933; Length: 15 pages. The PDF above matches this later citation, lacking "
die" in the title.
An English translation of this important paper was kindly provided in
February 2016 by Harvey A. Smith, Professor Emeritus of Mathematics at
Arizona State University:
https://emerituscollege.asu.edu/sites/default/files/ecdw/EVoice10/mythsandmiracles.html.
As a PDF:
Ulrich-Steudel-1933-English-translation-Dr-Harvey-A-Smith.pdf and Word file:
Ulrich-Steudel-1933-English-translation-Dr-Harvey-A-Smith.doc .
BBC-1947-12 BBC-1947-12-G.036.pdf Impulsive Interference in A.M. and F.M. , BBC Research Department Report G.036, Serial 1947/12 AKA
Impulsive Interference in AM and FM. With a 1951 corrigendum. Authors: D. Morris, G.F. Newell and J.G. Spencer.
BBC-1948-24 BBC-1948-24-G.040.pdf Experimental Correlation Between Aural and Objective Parameters of Electrical Noise, BBC Research Department Report G.040, Serial 1948/24.
CCIF-1949 #BBC-1968-EL-17
cites this as: C.C.I.F., Paris, 1949, Vol IV (Yellow Book), pp. 186 -
193. (I have not seen this - I am quoting the 1968 BBC report.)
Maurice-1950
Maurice, D., Newell, G. F. and Spencer, J. G. 1949
Electrical Noise, Wireless Engr.,
1950, XXVII, 316, pp 2 - 12. (I have not seen this, I am quoting
the 1968 BBC report.)
Mangold-1952
H. Mangold,
Grundlagen der
Geräuschspannungsmessung [
Fundamentals
of psophometric audio noise measurements], Rohde und Schwartz
Mitt., no. 1, pp. 21-36 (1952). I have not seen this paper.
According to
#Wilms-1970, this
paper mentions (on page 24) that AT&T proposed the
P
curve to the CCIF, presumably at or before 1949 when CCIF first adopted
it. Hertz-1977 also cites it, and it is possible that a 1952
chart in this paper comes from Mangold-1952, since it is the only 1952
reference.
#Belger-1953 also cites this paper.
Belger-1953 Ernst.
Belger,
Über die Messung und
Bewertung von Störgeräuschen [
On
the measurement and weighting of interfering noise],
Tech. Hausmitt. NWDR 5, 3/4 pp 51 - 59 (1953). The Wikipedia article
for Störgeräusch:
is quite detailed. Much of the progress in this field has been due to German workers with
their tremendous patience, attention to detail and insight into the
subtle aspects of physical reality. This article gives an English
translation of Störgeräusch as "interfering noise" but I understand
that it also means "disturbing noise". Therefore, an alternative
English translation of the title of Ernst Belger's paper might be "
On the measurement and weighting of
disturbing noise".
Thanks to Anne Runkel and Dr Hans-Ulrich Wagner (
http://www.hans-bredow-institut.de/en/node/2128) I now have a copy of this paper:
Belger_1953-graphic-scan.pdf . The pages are graphic images and do not contain text data.
(Still, Google has OCRed the entire document for its search engine
database!)
Here is another scan of the article with OCRed text as part of the PDF:
Belger_1953-with-German-text.pdf .
In June 2013, thanks to an anonymous translator, I have prepared an
English translation of
this paper, which is perhaps the most important in this field.
In July I improved this translation with the help of Hans-Martin
Burmeister:
Ernst Belger reviews the history and describes how he and his
colleagues devised a suitable weighting curve (filter to accentuate the
frequencies according to their ability to disturb) and how they chose a
peak detector with specific charge and discharge characteristics,
coupled to a slower positive movement and then return towards zero
response of a physical meter. It is my impression that Belger's
weighting curve, or something closely based on it, is used in the core
standards of this field: CCIR 468 and its derivatives. I don't
fully understand the experimental techniques described in this
paper.
The full journal title is:
Technische Hausmitteilungen des
Nordwestdeutschen Rundfunks
which means:
Internal Technical Memorandum of the
North-Western German Broadcasting Service
The form of this reference is based on its
citation by both the 1968 BBC paper and the 1970 Wilms paper.
Some links regarding where NWDR papers might be found:
Belger-1954
Ernst Belger,
Über die Messung und
Bewertung von Störwirkung von Geräushen, [Tr:
On the measurement and weighting of
interference effect of noise] Fernmedetech. Z., 1954, 7, 1, pp. 25 -
32. The full title of the journal is:
Fernmeldetechnische Zeitschrift (Telecommunication Technology Magazine)
I purchased the twelve 1954 issues and in July 2013, thanks to Hans-Martin Burmeister, we have an English translation.
Niese-1957
(as cited by the 1968 BBC report) Niese, H.,
Vorschlag für einen Lautstärkemesser zur
gehörrichtigen Anzeige. (Translation:
Suggestion for a volume meter with weighted loudness reading) Hochfrequenz. Tech. Electroakust., 1958, 66, 4, pp.
125 - 139.
Niese-1958
Niese, H.,
Vorschlag für einen neuen
Schallpegelmesser
Hochfrequenztechnik und Elektroakustik (
Proposal for a new sound level meter)
66 (1958), 4, 125.
CCITT-1960
Psophometeter for Broadband Circuits CCITT
Recommendation P53, New Delhi (1960) Red Book, Vol 5, pp 123 -
133. (I have not seen this, I am quoting Wilms' 1970 paper.)
Langmuir-1962
http://www.aes.org/e-lib/browse.cfm?elib=834
A New ASA Standard Sound Level Meter.
Langmuir, D. Bruce, JAES Volume 10 Issue 4 pp.
318-323; October 1962.
WG-8-1966
Proposal for the Extension of the
Precision SLM to an Impulse SLM
IEC TC 29/WG-8, Prague (1966). I have not seen this
document. I am quoting from Wilms-1970, reference 14, which he
cites on page 653. ??????????? More info
BBC-1968-EL-17
BBC Engineering Division,
Research
Report no EL-17 The assessment of noise in audio-frequency
circuits. http://downloads.bbc.co.uk/rd/pubs/reports/1968-08.pdf .
Reichardt-1968 W. Reichardt and K.
Notbohm, Anforderungen an ein Gerät
zur Messung des Pegels praktischer impulshaltiger Schalle
(Measurement of practical impulsive sound levels), Acustica 20,
159 (1968). I have not seen this paper. I am quoting reference 10
of Wilms-1970. I have been informed that the authors were at University of Dresden.
Smith-1970a
http://www.aes.org/e-lib/browse.cfm?elib=1515
Design Considerations of Low-Noise
Audio Input Circuitry for a Professional Microphone Mixer. Smith,
A. Douglas; Wittman, Paul H. Shure Brothers, Inc., Evanston, IL JAES
Volume 18 Issue 2 pp. 140-156; April 1970.
CCIR-1970-398-1
Measurement of Audio-Frequency
Noise in Broadcasting and in Sound Recording Systems CCIR Report
398-1, Study Program 2A/10, New Delhi 1970. I haven't seen a copy
of this. I am quoting Wilms-1970.
Wilms-1970
http://www.aes.org/e-lib/browse.cfm?elib=1460
Subjective or Psophometric Audio
Noise Measurement: A Review of Standards. Wilms,
Herman A, National Institute for Radio- and Filmtechnique, Brussels,
Belgium. JAES Volume 18 Issue 6 pp. 651-656; December 1970.
Smith-1970b
http://www.aes.org/e-lib/browse.cfm?elib=1469
Comments on "Subjective or
Psophometric Audio Noise Measurement: A Review of Standards".
Smith, A. Douglas, Shure Brothers Inc., Evanston, IL, JAES Volume 18
Issue 6 p. 677; December 1970.
Steffen-1972
Steffen, E.; Untersuchungen zur
Geräuschspannungsmessung (Investigations for noise voltage
measurements) Techn. _tt. d. RFZ 16 (1972) 3, 81-84. A more correct citation is:
Steffen, Edith: Untersuchungen zur Geräuschspannungsmessung.
Techn. Mitt. des RFZ 16(1972) H.3, S.81-84. The journal is
Technische Mitteilungen des RFZ (Technical Transactions of the
Rundfunk- und Fernsehtechnisches Zentralamt, the East German Post
Radio and Television Technical Central Office.)
Hertz-1973 http://www.aes.org/e-lib/browse.cfm?elib=1728
A New Solid State Peak Programme
Meter, Hertz, Bent F., NTP Audio, Copenhagen, Denmark AES
Convention:44 March 1973.
CCIR-1974-398-2
OCIR-Report 398-2, Measurement of Audio-Frequency Noise in Broadcasting
and in Sound Recording Systems. CCIR, XIIIth Plenary Assembly, Geneva
1974, Vol. X. I haven't seen this report. I am quoting #Steinke-1984 .
Hertz-1977
http://www.aes.org/e-lib/browse.cfm?elib=3161
Psophometric noise measurement on
audio equipment, Bent Hertz, Danish Broadcasting Copenhagen.
(Note, the paper itself is titled Noise
measurement on audio equipment.)
Dolby-1978
http://www.aes.org/e-lib/browse.cfm?elib=3218
CCIR-ARM: A Practical
Noise-Measurement Method.
Dolby, Ray; Robinson, David; Gundry, Kenneth J., Dolby Laboratories,
Inc., San Francisco, JAES Volume 27 Issue 3 pp. 149-157; March 1979.
(The use of "CCIR" in the name of this proposal is not authorised by
CCIR or its its successor, the ITU-R.)
Holman-1978
http://www.aes.org/e-lib/browse.cfm?elib=2926
Noise in Audio Systems
Tomlinson Holman, Apt Corporation, Cambridge Massachusetts, AES
Convention November 1978.
Jakubowski-1980 Jakubowski, H.; Quantisierungsverzerrungen
in digital
arbeitenden Tonsignal_bertragungs-
und verarbeitungsstemen
(Distortions in digital sound systems for transmission and processing)
Rundfunktechnische Mitteilungen 24 (1980) 2, 91-92
Steinke-1984
http://www.aes.org/e-lib/browse.cfm?elib=11778
Important CCIR-Standards for the
Audio-World,
Steinke, Gerhard, RundFunk- und Fernsehtechnisches Zentralamt der
Deutschen Post, Berlin, German Democratic Republic (GDR). AES
Convention: March 1983.
Peus-1997
http://www.aes.org/e-lib/browse.cfm?elib=7162
Freely available at: http://neumann.com/download.php?download=lect0020.PDF
Measurements on Studio Microphones,
Stephan Peus, Georg Neumann GmbH, Berlin, Germany. AES Convention:103
(September 1997).
Skirrow-1999
Audio measurements and test equipment,
Peter Skirrow (home page)
of Lindos Developments, section of Audio Engineer’s Reference Book, 2nd
ed. Michael Talbot-Smith, editor. Focal Press, 1999. Pages 3-94 to
3-108.
Weeks-1999 International standards for sound systems
and equipment,
Vivian Weeks, formerly of BBC Design and Equipment Department, section
of Audio Engineer’s Reference Book, 2nd ed. Michael Talbot-Smith,
editor. Focal Press, 1999. Pages 7-19 to 7-33.
Bohn-2000
Bewildering Wilderness - Navigating
the complicated and frustrating world of audio standards,
Dennis A. Bohn, President of Research and Development, Rane
Corporation. Sound and Video Contractor, September 2000, pages 56
to 64.
http://www.rane.com/pdf/bewilder.pdf
.
http://www.aes.org/e-lib/browse.cfm?elib=1469
Update history
2009-09-07: Initial version, password protected - only a few people saw it.
2012-03-01: A few updates and made it public.
2013-06-18: Added English
translation of Ernst Belger's 1953 paper. Noted that IEC 60268-4
has 468-4 as the primary noise measurement technique.
Corrected several items thanks to help from a fellow in Germany,
including the correct name for the journal in which Ernst Belger's 1954
paper appeared. Added this Update history section. I did
not attempt to revise the main body of material. In days
following this I added some PDFs from the BBC and the ITR-R and made a
number of minor improvements.
2013-07-02: Added graphic
scan and German OCR version of Ernst Belger's 1954 paper.
Improved the translation in his 1953 paper.
2013-07-11: Added an English translation of Ernst Belger's 1954 paper.
2014-06-21: Added a graphic
scan of Ulrich Steudel's 1933 paper, a translation of one sentence from
page 123 and the two waveform files and a graphic depicting them.
Corrected some typos and
replaced some rough translations (from Google) with real translations
from Hans-Martin
Burmeister.
2016-02-12: Added an English translation of Ulrich Steudel's 1933 paper.
.